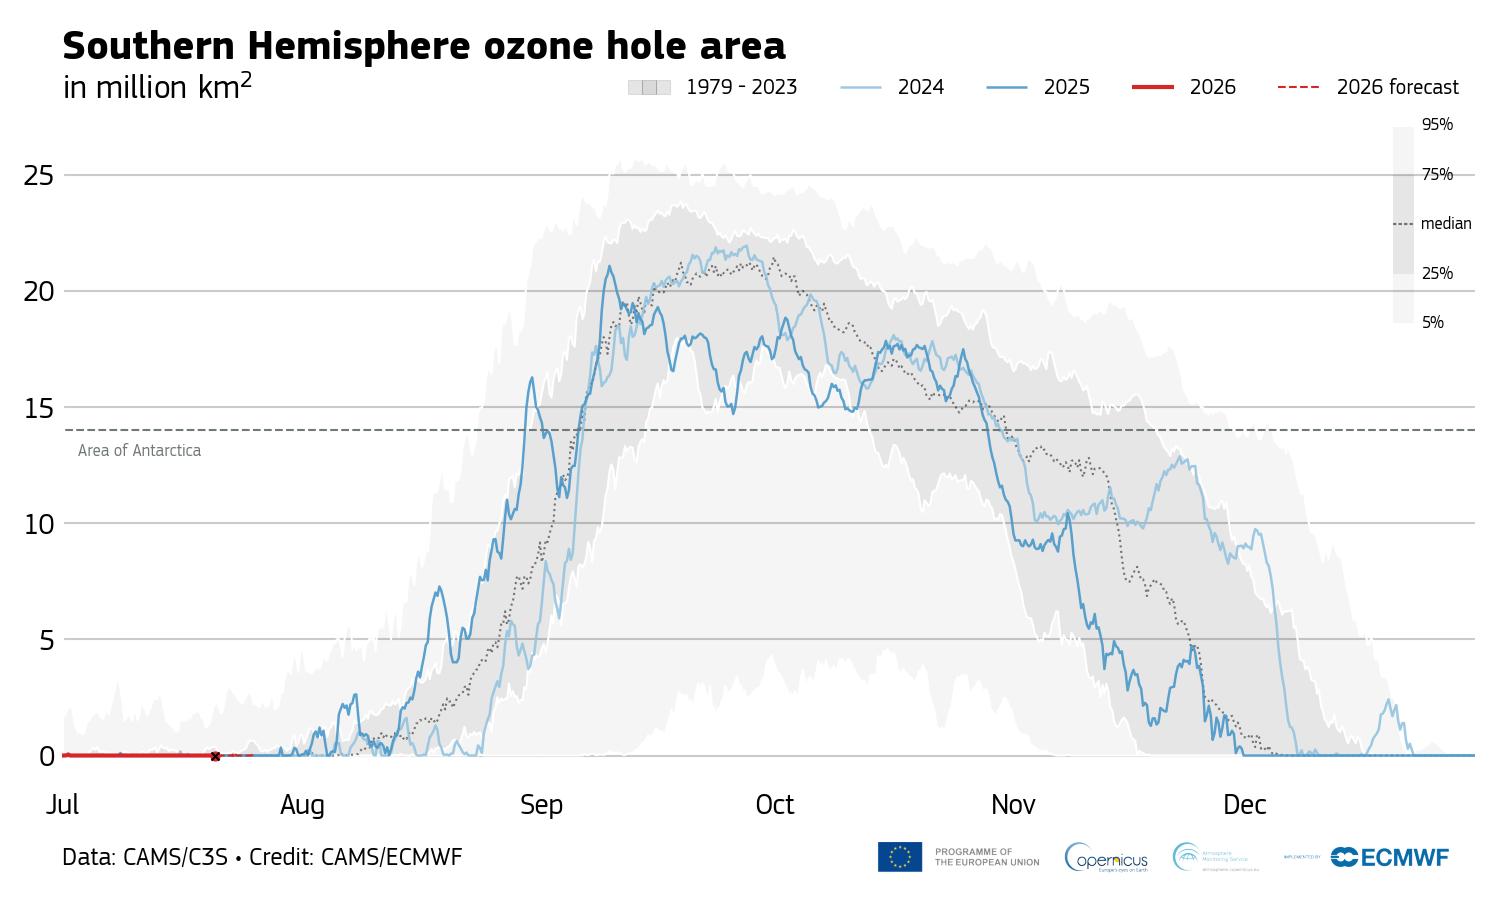
On October 19, 2026, we checked every statement, number and source on the original infographic, 58 items, against CAMS’s release and news item of 16 September, its monitoring page and the data files behind its charts, NASA Ozone Watch’s daily files for 1979–2026 and its season summaries, the WMO Bulletin’s page, NOAA and NASA’s summary of the 2025 season and the 2022 Assessment of ozone depletion. We recomputed the percentiles, ranks and dates from the data files, measured the original charts against the data, and followed the season to 18 October. The check corrected several statements; the change log lists them.
The verdicts and the items tagged “Our analysis” are our own assessment, built on the cited sources: the percentiles, ranks and comparisons we computed from the agencies’ data files. The charts are redrawn from CAMS’s and NASA’s published data; CAMS’s licence allows adapted data with the notice given under each chart [7], and NASA Ozone Watch asks to be credited as the source [13].
After the page was built, a second reviewer who hadn’t seen the drafting recomputed the numbers from the raw CAMS and NASA files, decoded both charts and checked them against the data, to within 0.01 million km², and checked every quotation and reference. The changes that followed: NASA’s 2026 peak is its seventh-largest yearly peak, not daily value; the cooling claim now rests on CAMS’s temperature series, with record lows on 22 August and 13 September and a 4 °C drop from 4 to 9 September, because NASA’s file switched to a colder analysis on 1 August; the 2006 “record” is described as a mix-up of two NASA figures rather than a wrong date; the change log now lists the edits it had missed; and several smaller corrections, including the full Copernicus notice under every chart.
This page was researched and written with Claude, an AI assistant made by Anthropic, and then re-checked against its sources in a separate verification pass.