Fact-Checked Science

Evidence review · S0 News, 27 October 2026

S0 News, October 27, 2026: a 1770 storm, not a new superflare, and no 89-year clock

On October 27, 2026, S0 News said researchers had “identified a new super flare in recent history”, and that “the math suggests something brutal for the next sunspot cycle” [1 00:00:19–00:00:24]: jumps of about 89 years from 1770 to 1859, 1948 and “2037 2038” [1 00:01:53]. The linked paper reconstructs a geomagnetic storm long on record, not a flare, and forecasts nothing [2 Abstract][2 §2.1]. Our paper checks cover the two links; this page checks the episode’s arithmetic, its Sun and its cyclone [1 00:00:30–00:00:51].

Our analysis marks our own reasoning and calculations, and the verdicts are our assessment. Everything else comes from the numbered sources. For the episode [1], times are positions in the video; for the papers, Abstract names the part we used, § a section and p. a page. The space weather centres’ times are UTC; India’s IST is five and a half hours ahead.

Code and numbersDownload as PDFSourcesHow this was checkedCorrections

A 1770 storm, not a new superflare; a rhythm the record doesn’t keep; a Sun and a cyclone described right

Our assessment

0

Our analysis: days with Kp 9, the top of the scale of geomagnetic storms, in 1948, the year the presenter’s 89-year jump lands on, and none at 9− either; its highest was 8+. Cycle 18 had two, both in 1946, against an average of 3.25 a cycle, and 13 counting the days at 9− [14].

88.3 years

Our analysis: eight average sunspot cycles, at 11.03 years each, by the dates of every cycle’s minimum since 1755 [13]. The presenter’s 89-year steps are eight sunspot cycles.

6,132

Our analysis: millionths of the Sun’s hemisphere covered by the largest sunspot group in the Greenwich record, on April 8, 1947, in cycle 18; the five largest of 1874–1976 all came in that cycle [15], as the presenter had it: “some of the biggest sunspot groups ever” [1 00:01:47–00:01:50].

The episode’s claims

Misread

A new superflare identified

“They identified a new super flare in recent history” [1 00:00:19–00:00:21]

The linked paper reconstructs “the geomagnetic superstorm of September 1770” from Chinese auroral records [2 Abstract]: a disturbance of Earth’s magnetic field, not a flare, and it identifies no flare. Nor is the storm new: it is in a catalogue of ancient Chinese aurorae published in 1980 [2 §2.1], its sightings were described in 1996 [4], and it was analysed as an extreme magnetic storm in 2017 [5][6]. Same label and verdict as our check of the paper. See section 3.

False

Killer storms every 89 years

“1770 to 1859 is 89 years. It’s the Glyceberg cycle, the critical vote favored solar cycle for killer events about 88.8 years.” [1 00:01:25–00:01:33]

The Gleissberg cycle is real, with “a mean period of about 90 years”, so his period is about right; but it is “a modulation of the cycle envelope with a varying timescale of 60–140 years” [8 §2.4.1], a slow rise and fall in how strong sunspot cycles get. Studies have looked at extreme storms and the cycle’s phases [6 §5][12], which is not a regular 89-year clock, and the record runs against one: the Carrington-class storms of 1872 and 1921 came off the 89-year marks, and the 1948 mark brought none [14], as our check of the paper found. Same label and verdict there. See section 4.

Partly true

1948: Kp 9 storms, record spots

“we’ll jump from 1859 Carrington event 89 years ahead and you get 1948, one of the most active solar cycles we have ever seen. lots of KP9 events and some of the biggest sunspot groups ever.” [1 00:01:36–00:01:50]

Right about the cycle and its sunspots: cycle 18, which peaked in May 1947, was the 8th strongest of 25 [13], and the five largest sunspot groups in the Greenwich record of 1874–1976 all came in it [15]. Wrong about 1948: it had no day with Kp 9, nor one at 9−. The cycle had two days at Kp 9, both in 1946, below the average of 3.25, though counting the days at 9− it had 13, tied second of eight cycles (Our analysis) [14]. See section 4.

Unsupported

A brutal cycle we won’t survive

“the math suggests something brutal for the next sunspot cycle” [1 00:00:21–00:00:24]; “One more 88-year jump takes us to 2037 2038 area. … The one I’ve already said we’re not going to make it through.” [1 00:01:50–00:02:02]

Cycle 26 is forecast to peak around 2034–35, about as strong as cycle 25 or weaker [16 Abstract][18 Abstract]; 2037–38 would fall in its decline [19]. “The math” is the presenter’s arithmetic, not the paper’s, which forecasts nothing; its own model would make a storm like 1770’s a once-in-about-14,000-years event [2 Abstract], a figure our check of the paper rates Overstated. See section 5.

True

Limb eruptions, nothing at us

“Limb eruptions and farside cmemes were popping for half the day. Nothing aimed our way. Coronal hole and filaments are facing us directly today.” [1 00:00:34–00:00:43]

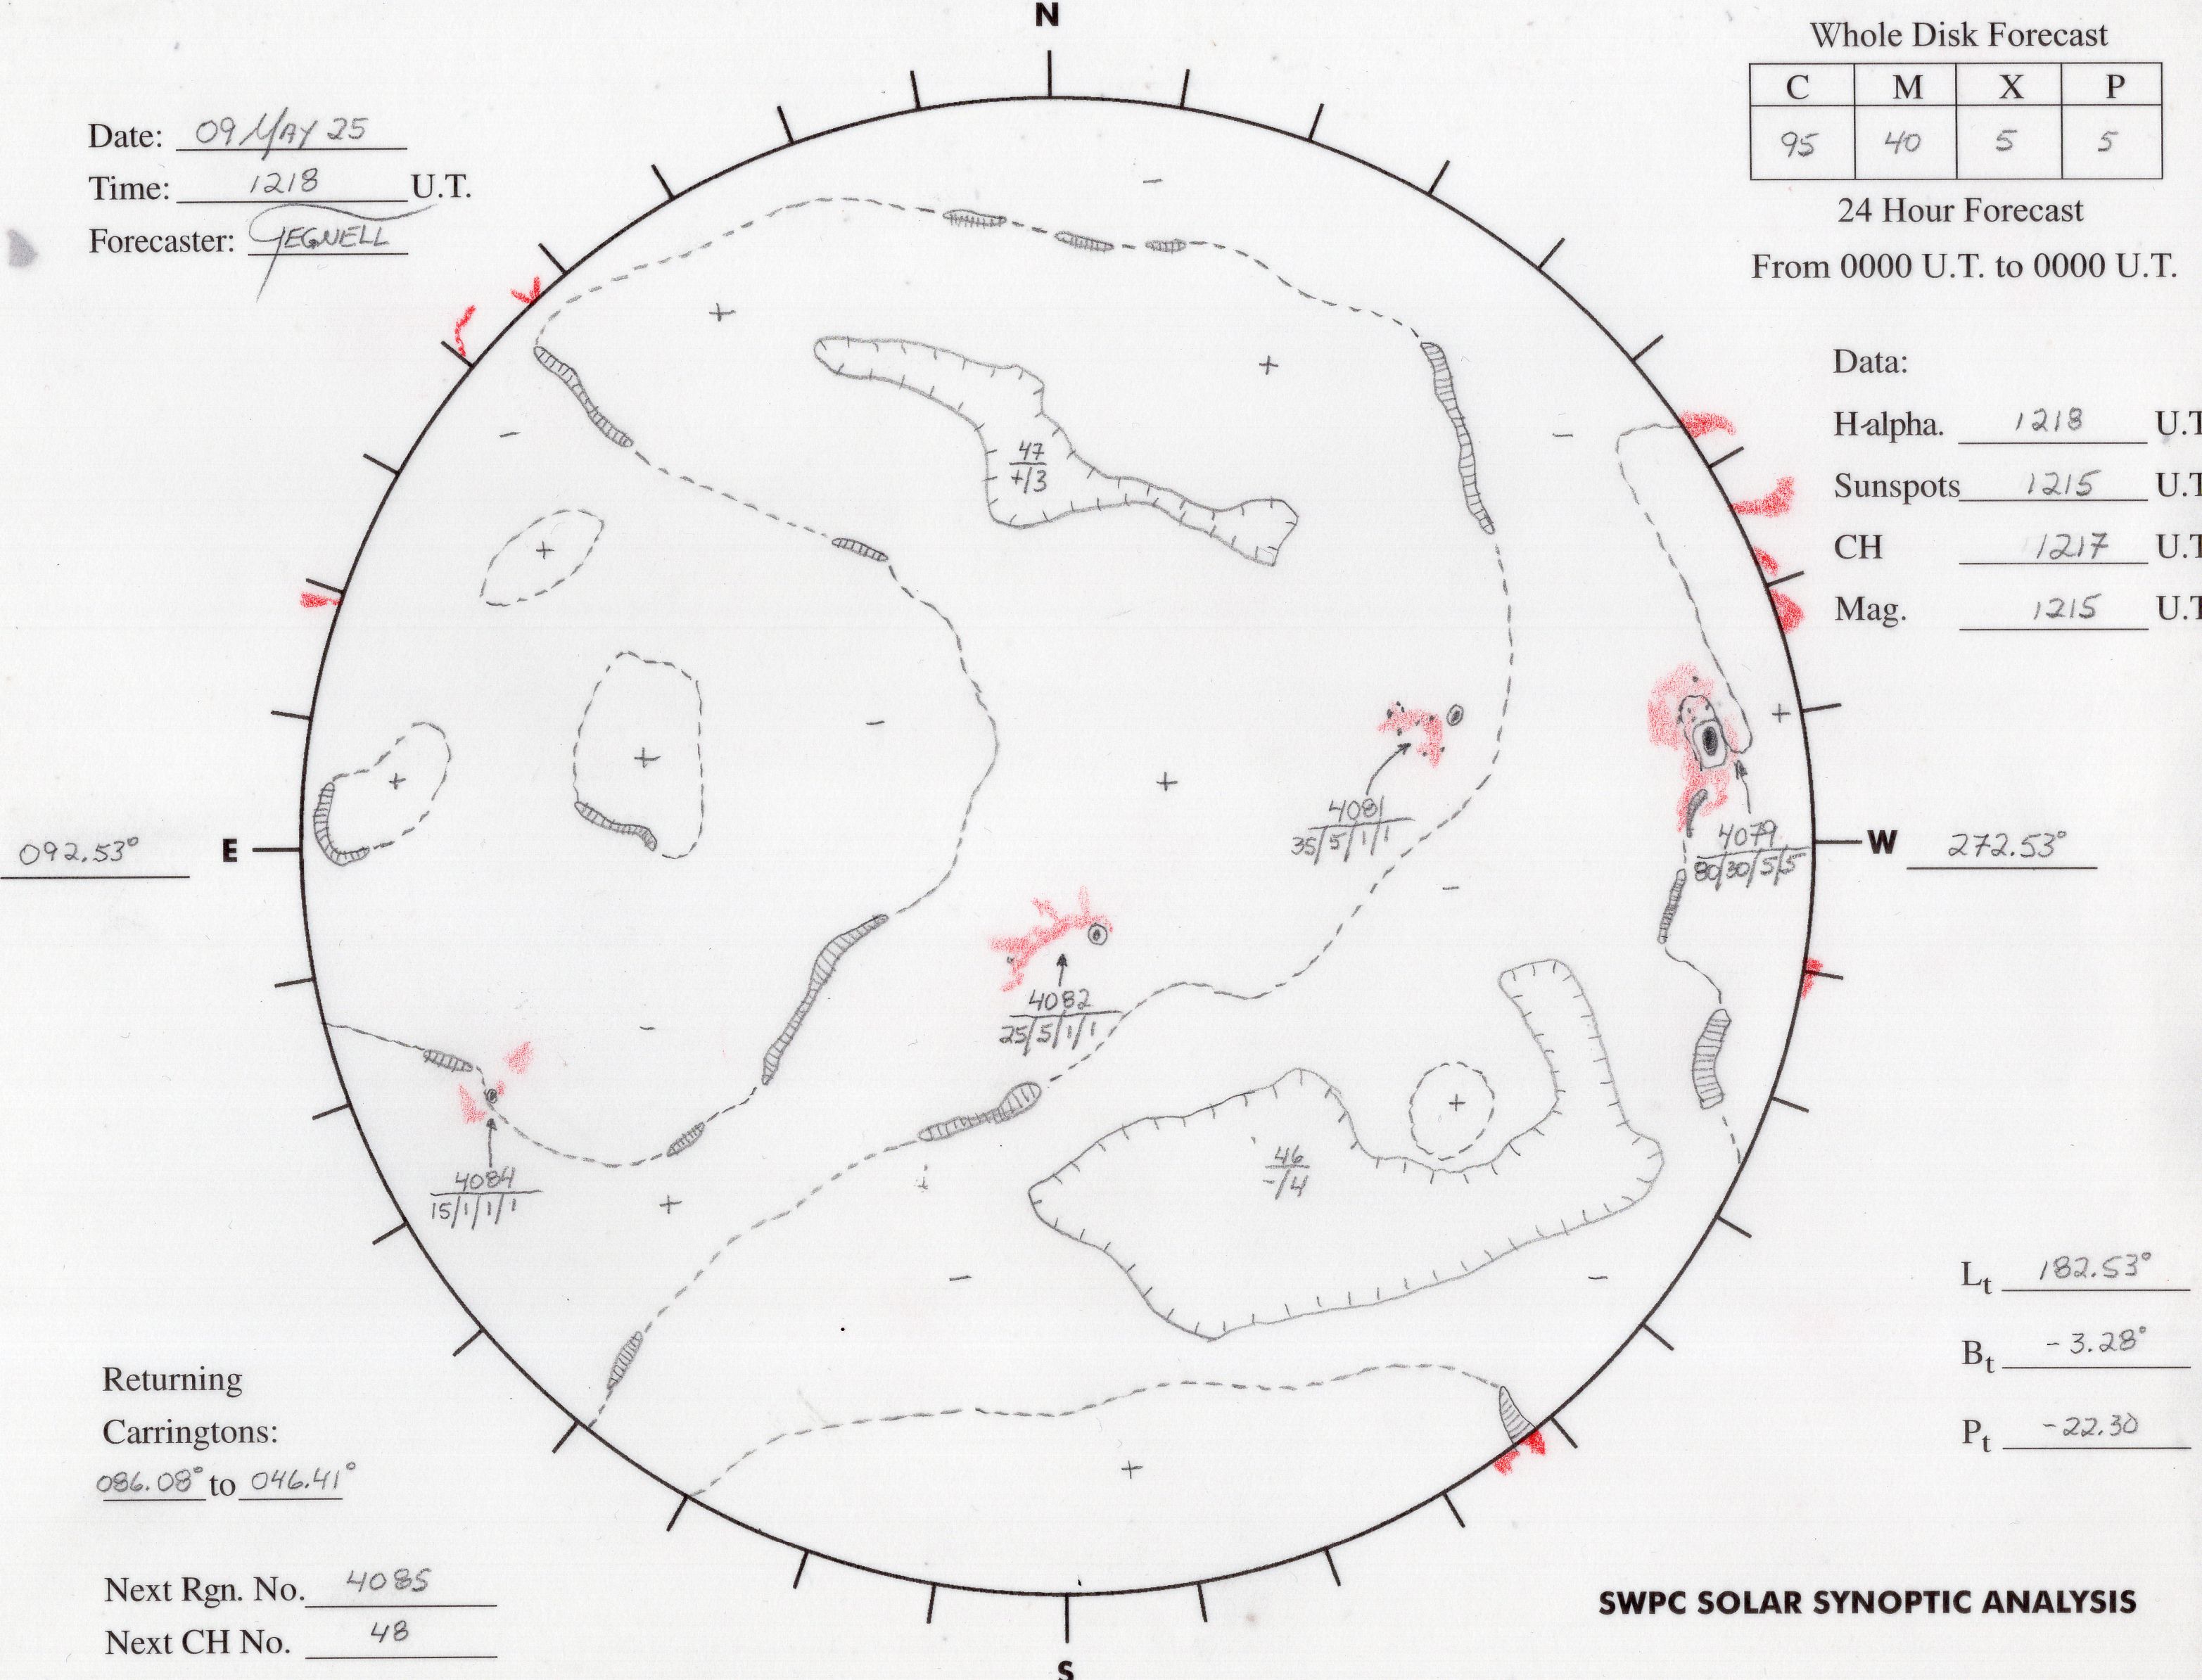
The day’s two C-class flares came from regions at and behind the Sun’s west limb [25][29], so far-side flaring, though no far-side CME, was recorded; its two coronal mass ejections left over the limbs [30], and neither SWPC nor SIDC saw an Earth-directed one [23][29]; and a coronal hole had just crossed the centre of the disk, with filaments across it [29][27]. Seven minutes after the upload, SWPC said a north-east eruption might bring “glancing effects” on October 31 [23]. See section 6.

True

Cyclone slams into India today

“That cyclone is going to slam into India today and it is not going to be fun.” [1 00:00:47–00:00:51]

Thirty-eight minutes before the upload, the India Meteorological Department had very severe cyclonic storm Arnab 140 km from Kakinada, forecast to cross the Andhra Pradesh coast at 125–135 km/h, gusting to 150 [31]. By 21:30 IST it expected landfall at 2–4 a.m. on October 28, still October 27 in UTC and in the presenter’s Arizona [31][34]. IMD reported that it crossed near Narsapur, south-west of Yanam, from 20:30 UTC on October 27 to 02:30 UTC on the 28th, the afternoon and evening of the 27th in Arizona, as a very severe cyclonic storm at 125–135 km/h, gusting to 150 [45][46]. See section 7.

1 · The episode

A storm from 1770, a cyclone over India and the galaxy, in three and a half minutes

The episode of October 27, 2026, ran 3 minutes 33 seconds and linked two papers: a reconstruction of a geomagnetic storm in September 1770 [2] and a model of bending waves in the disk of a galaxy [3] [1]. It opened with “They identified a new super flare in recent history, and the math suggests something brutal for the next sunspot cycle” [1 00:00:19–00:00:24], and its title promised a “2037 Superflare” [1].

In the episode’s words

Quoted from the automatically generated transcript. “Kan Long” is its rendering of Qianlong, “Glyceberg” of Gleissberg, “helioraphic” of heliographic, “cmemes” of CMEs (coronal mass ejections) and “KP9” of Kp 9; “critical vote favored” is unclear, perhaps “critical, most favored”. The sign-off’s “6:00 a.m.” is a stock phrase: the video went up at 5:22 a.m. Arizona time [1].

“in the last 24 hours on the sun were quiet but only on the earth facing helioraphic longitudes. Limb eruptions and farside cmemes were popping for half the day. Nothing aimed our way. Coronal hole and filaments are facing us directly today. So we’ve got eyes on those.”

“That cyclone is going to slam into India today and it is not going to be fun. Several of the critical flood risk areas are taking the fury of the sky at dangerous levels for nearly 24 straight hours as the cyclone creeps northward. This is the type of storm that causes India’s most severe short-term disasters. And as the people there begin to clean up, there will be another storm tossed out of the same island region that instead wants to head north.”

“And now I’m doing math in my head. 1770 to 1859 is 89 years. It’s the Glyceberg cycle, the critical vote favored solar cycle for killer events about 88.8 years. That’s 89 in my book. Okay, we’ll jump from 1859 Carrington event 89 years ahead and you get 1948, one of the most active solar cycles we have ever seen. lots of KP9 events and some of the biggest sunspot groups ever. One more 88-year jump takes us to 2037 2038 area. That’s the next solar cycle from right now. The one I’ve already said we’re not going to make it through.”

2 · The papers

Two papers, and what the episode made of them

Both links are checked on their own pages; the cards below repeat those pages’ verdicts. This page rates the episode’s own statements: its line-up, its arithmetic, the Sun and the cyclone.

The storm of September 1770, reconstructed

What it is
A peer-reviewed, open-access article in Frontiers in Astronomy and Space Sciences, published October 21, 2026, by Ding Yuan and nine colleagues at universities in China, India, Belgium, Poland and the United Kingdom [2]. The episode’s link “1770 Solar Superstorm” [1].
What the authors claim
From the most equatorward sighting in Chinese chronicles, “a best-estimate Disturbance Storm Time (Dst) index of −1,319 nT (95% Confidence Interval (CI): [−1,832, −1,066]), exceeding the reconstructed Dst intensity of the 1859 Carrington event (≈ −1,025 nT, 95% CI of [−1367, −853]) by approximately 30%”, and “an order-of-magnitude recurrence interval of approximately 14,000 years” for a storm of that size [2 Abstract].
What the episode said
“They say it produced a geomagnetic storm 30% larger than the Carrington event of 1859.” [1 00:01:17–00:01:22]

In our check of Yuan et al. (2026): “A new superflare identified” Misread; “They say 30% larger than 1859” True; “A Carrington-class storm” True; “About 30% stronger than 1859” Overstated; “Once in about 14,000 years” Overstated; “Killer storms every 89 years” False. The paper says nothing about the Gleissberg cycle, 1948, 2037 or cycle 26 [2].

Bending waves in a disk of stars

What it is
A peer-reviewed, open-access article in Astrophysics and Space Science, published October 8, 2026, by Evgeny Griv and Asher Yahalom [3]. The episode’s link “Galactic Corrugation” [1].
What the authors claim
A linear theory of a rotating disk of stars held together by its own gravity, in which “The self-excitation of oscillatory-growing, spiral bending waves via the wave-star resonant interaction is proposed to be responsible for” the disk’s ripples: “It is a collective effect, meaning it arises from the interaction of many stars with the perturbation’s gravitational field.” [3 Abstract]
What the episode said
“we’ve got more and more papers from scientists diagnosing and measuring and theorizing about the galactic plane, the magnetic rippling, wavy corrugation of the galactic sheet. This one is about the mechanics of how the waves form and are maintained.” [1 00:02:07–00:02:19]

In our check of Griv and Yahalom (2026): “Magnetic rippling of the sheet” Misread; “About how the waves form” True; “They knew the math long ago” Partly true; “Seen more than a decade ago” True; “Just figuring out how it exists” Partly true; “Disks can ripple on their own” Unconfirmed. The model is gravity and the motions of stars; that check found “magnetic” in it only in analogies and citations, and no sheet [3].

The promotion: an online course

What it is
“The Roadmap”, a course from the presenter’s Observer Courses that “brings together Master the Disaster and Phoenix Rising into one comprehensive course”: 49 lessons for $24.99; “Phoenix Rising” alone is 8 lessons for $39.99, by the product pages [42]. Not used as evidence, and not rated here.
What the episode said
“Folks, there are 65 days left in the year of the prepper. 2027 and the creation of the tribes is going to be here before you know it. … step two is the strategy, your road map to the next age of Earth, master the disaster in Phoenix Rising. It’s priced with a zero missing from the end because my number one purpose on this planet right now is to get as many of you ready for 2027 as possible.” [1 00:02:38–00:03:09]
What is disclosed
The description lists The Roadmap as “STEP 2: STRATEGY” and Phoenix Rising as “STEP 4”, beside promo codes (“10% OFF with Promo Code: SOLAR”) for two other companies and a referral code for a bunker builder; it states no commercial relationship with them, and the video’s data carry no paid-promotion flag [1].

Not rated.

Our analysis

“Continuing detail … on the galactic current sheet”: Misread

The line-up promised “continuing detail coming out on the galactic current sheet” [1 00:00:24–00:00:28], and presented the bending-wave paper as part of it. The paper models stars and their gravity with “the Poisson and collisionless Boltzmann equations” [3 Abstract]; it has no magnetic field, no current and no sheet, as our check of it found. Whether a galactic current sheet exists is a separate question, rated at stop 14 of our video check: the only one we found in the literature is a 1978 speculation by Alfvén and Carlqvist [41], and nothing has been seen sweeping through solar systems (Unsupported). The ripples that have been seen are explained mostly by gravity, the Radcliffe Wave’s oscillation by the Galaxy’s own pull, and none of the explanations involves a current sheet (extra x6, False). The closing line, “may want to listen to us when we tell you what it’s doing” [1 00:02:33–00:02:38], points back to those claims; nothing in the paper concerns Earth.

3 · A new superflare

A storm in Earth’s field, catalogued and studied for decades, not a newly found flare

“They identified a new super flare in recent history” [1 00:00:19–00:00:21]. The paper behind the line reconstructs a geomagnetic storm, and says so in its first lines [2 Abstract].

In the sources’ words

The 1996 paper is quoted as read for our check of the 1770 paper.

“we quantitatively reconstruct the geomagnetic superstorm of September 1770 (termed Qianlong XXXV storm) using systematically documented auroral observations preserved in Chinese regional chronicles”

“Historical sunspot records suggest an extraordinarily large source region, with a corrected area of 6,000 millionths of the solar disk—roughly twice the size of the Carrington sunspot group”

The sightings of 1770 “clearly coincided with a major geomagnetic storm” and are “the earliest example yet known of conjugate auroral sightings”.

A storm, not a flare

A flare is a burst of light from the Sun lasting minutes to hours; a geomagnetic storm is the disturbance of Earth’s field when a solar eruption arrives, usually a day or more later. What survives from 1770 is the storm, seen as aurora: the paper estimates its size from how far toward the equator the aurora reached [2 Abstract]. It does not identify the flare, and says only that the 1770 active region “was capable of powering an unusually energetic solar-terrestrial event” [2 §4]. Superflares, as astronomers use the word, are flares of about 1033 to 1036 erg seen on other Sun-like stars (our check of superflares); Carrington’s flare of 1859 is estimated at about X45 (stop 1).

Our analysis

“A new superflare identified”: Misread

The line turns a storm into a flare, and an old storm into a new find. The paper is a new estimate of the storm’s size, not a discovery: it uses the Japanese records that Hayakawa and colleagues published in 2017 and records from modern catalogues of Chinese aurorae, one of them published in 1980 [2 §2.1][6], and Willis and colleagues had described sightings from Captain Cook’s Endeavour, China and Japan in 1996 [4]; Kataoka and Iwahashi presented “Graphical Evidence of Extreme Magnetic Storm” from Kyoto the same year as Hayakawa [5]. None of these is a flare record, and in 1770 none could be: the first flare ever seen was the one that Carrington and Hodgson each observed in 1859, as our check of the paper notes. That check rates the line the same way, with the same label.

The 1770 storm is a well-known extreme storm, re-measured; the paper finds no flare and forecasts nothing.

4 · The 89 years

Eight sunspot cycles, and a year without a single Kp 9 day

“1770 to 1859 is 89 years. It’s the Glyceberg cycle, the critical vote favored solar cycle for killer events about 88.8 years.” [1 00:01:25–00:01:33] Then: “we’ll jump from 1859 Carrington event 89 years ahead and you get 1948” [1 00:01:36–00:01:42].

The Gleissberg cycle, in the literature’s words

Gleissberg (1939) and Hayakawa et al. (2017) are quoted as read for our check of the 1770 paper.

Four-cycle means of the sunspot maxima since 1750 rise and fall twice, “the period being about seven or eight sun-spot cycles”.

“the Gleissberg cycle is not a cycle in the strict periodic sense but rather a modulation of the cycle envelope with a varying timescale of 60–140 years”

“the century-type cycle of Gleissberg has a wide frequency band with a double structure consisting of 50–80 years and 90–140 year periodicities”

“During this whole period, the Gleissberg cycle in 14C concentration has a period of 87.8 years”, over about 11,854 years.

“all local peaks with enhanced power, apart from the 11-year band, are consistent with realization noise”

Cameron and Schüssler (2019), on peaks such as “the 90-year Gleissberg cycle” [11 Abstract]

The 1770 storm’s timing is “consistent to the apparent 60−100-year period of extreme solar flares”.

The presenter’s jumps land on every eighth sunspot cycle

Our analysis
  • The cycles of the presenter’s years
  • Other cycles
  • Cycle 26, forecast
The 89-year jumps land on every eighth sunspot cycle Bar chart of the smoothed maximum sunspot number of each cycle, from WDC-SILSO: cycle 1, 144.1 in 1761; cycle 2, 193.0 in 1769; cycle 3, 264.2 in 1778; cycle 4, 235.3 in 1788; cycle 5, 82.0 in 1805; cycle 6, 81.2 in 1816; cycle 7, 119.2 in 1829; cycle 8, 244.9 in 1837; cycle 9, 219.9 in 1848; cycle 10, 186.2 in 1860; cycle 11, 234.0 in 1870; cycle 12, 124.4 in 1883; cycle 13, 146.5 in 1894; cycle 14, 107.1 in 1906; cycle 15, 175.7 in 1917; cycle 16, 130.2 in 1928; cycle 17, 198.6 in 1937; cycle 18, 218.7 in 1947; cycle 19, 285.0 in 1958; cycle 20, 156.6 in 1968; cycle 21, 232.9 in 1979; cycle 22, 212.5 in 1989; cycle 23, 180.3 in 2001; cycle 24, 116.4 in 2014; cycle 25, 160.9 in 2024. The presenter’s three years fall in cycles 2 (1770), 10 (1859) and 18 (1948), eight cycles apart, and his 2037 to 2038 in cycle 26, whose forecast maxima run from about 109 to 161. 0 100 200 300 Cycle 1: 144.1, maximum 1761-06 1 Cycle 2: 193.0, maximum 1769-09; the presenter’s 1770 1770 2 Cycle 3: 264.2, maximum 1778-05 3 Cycle 4: 235.3, maximum 1788-02 4 Cycle 5: 82.0, maximum 1805-02 5 Cycle 6: 81.2, maximum 1816-05 6 Cycle 7: 119.2, maximum 1829-11 7 Cycle 8: 244.9, maximum 1837-03 8 Cycle 9: 219.9, maximum 1848-02 9 Cycle 10: 186.2, maximum 1860-02; the presenter’s 1859 1859 10 Cycle 11: 234.0, maximum 1870-08 11 Cycle 12: 124.4, maximum 1883-12 12 Cycle 13: 146.5, maximum 1894-01 13 Cycle 14: 107.1, maximum 1906-02 14 Cycle 15: 175.7, maximum 1917-08 15 Cycle 16: 130.2, maximum 1928-04 16 Cycle 17: 198.6, maximum 1937-04 17 Cycle 18: 218.7, maximum 1947-05; the presenter’s 1948 1948 18 Cycle 19: 285.0, maximum 1958-03 19 Cycle 20: 156.6, maximum 1968-11 20 Cycle 21: 232.9, maximum 1979-12 21 Cycle 22: 212.5, maximum 1989-11 22 Cycle 23: 180.3, maximum 2001-11 23 Cycle 24: 116.4, maximum 2014-04 24 Cycle 25: 160.9, maximum 2024-10 25 Cycle 26: forecast maxima about 109–161, around 2034–35; the presenter’s 2037–38 2037? 26 8 cycles 8 cycles 8 cycles Sunspot cycle

Smoothed maximum sunspot number, by cycle

Our analysis, from WDC-SILSO’s dates and values for each cycle’s minimum and maximum, 13-month smoothed monthly sunspot number (version 2), CC BY-NC 4.0 [13]. Cycle 26’s box spans Zermane and colleagues’ two forecasts, 109 and 161 [16 Abstract]; the other values in section 5 fall in or near it, in their own measures. The storms of 1770 and 1859 came within about a year of a solar maximum, and 1948 a year after one [13]. Hover or tap a bar for its value.
Our analysis

Why the jumps land on busy years

Sunspot cycles have averaged 11.03 years since 1755, so eight of them take 88.3 years; eight in a row have taken from 83.1 to 94.2 years [13]. Both storms struck near the top of a cycle: 1770’s about a year after cycle 2 peaked, 1859’s about five months before cycle 10 did [13]. Storms at the top of the scale come mostly in the years around a solar maximum, as the chart below shows [14], so a jump of about eight cycles from a storm near one maximum tends to land near another, whatever the Gleissberg cycle does. 1948 did: cycle 18 had peaked the year before [13]. The jump finds a busy Sun, not a storm.

Days with Kp 9, year by year, 1932 to 2026

Our analysis
  • Days whose highest Kp was 9, the top of the scale (NOAA’s G5)
  • Days whose highest was 9− (NOAA’s G4)
  • 1948
Days with Kp 9, year by year, 1932 to 2026 Bar chart of the days each year whose highest three-hour Kp reached 9, the top of the scale, with the days that reached 9 minus stacked on top, from 1932 to October 2026, in GFZ’s Kp record. Days at Kp 9 came in 1938 (1), 1940 (1), 1941 (3), 1946 (2), 1957 (1), 1958 (2), 1959 (1), 1960 (3), 1967 (2), 1970 (1), 1972 (1), 1982 (2), 1986 (1), 1989 (2), 2000 (1), 2003 (2), 2024 (1). 1948 has none, and no day at 9 minus either; cycle 18, from 1944 to 1954, had two days at Kp 9, both in 1946. 0 2 4 6 8 1938: 1 day at Kp 9, 2 more at 9− 1938: 2 days at Kp 9−, 1 at Kp 9 1939: 1 day at Kp 9− 1940: 1 day at Kp 9, 2 more at 9− 1940: 2 days at Kp 9−, 1 at Kp 9 1941: 3 days at Kp 9, 1 more at 9− 1941: 1 day at Kp 9−, 3 at Kp 9 1946: 2 days at Kp 9, 5 more at 9− 1946: 5 days at Kp 9−, 2 at Kp 9 1947: 1 day at Kp 9− 1949: 2 days at Kp 9− 1950: 1 day at Kp 9− 1951: 2 days at Kp 9− 1956: 1 day at Kp 9− 1957: 1 day at Kp 9, 6 more at 9− 1957: 6 days at Kp 9−, 1 at Kp 9 1958: 2 days at Kp 9, 1 more at 9− 1958: 1 day at Kp 9−, 2 at Kp 9 1959: 1 day at Kp 9, 1 more at 9− 1959: 1 day at Kp 9−, 1 at Kp 9 1960: 3 days at Kp 9, 2 more at 9− 1960: 2 days at Kp 9−, 3 at Kp 9 1961: 2 days at Kp 9− 1963: 2 days at Kp 9− 1966: 2 days at Kp 9− 1967: 2 days at Kp 9 1970: 1 day at Kp 9, 1 more at 9− 1970: 1 day at Kp 9−, 1 at Kp 9 1972: 1 day at Kp 9, 1 more at 9− 1972: 1 day at Kp 9−, 1 at Kp 9 1974: 1 day at Kp 9− 1982: 2 days at Kp 9, 1 more at 9− 1982: 1 day at Kp 9−, 2 at Kp 9 1986: 1 day at Kp 9, 2 more at 9− 1986: 2 days at Kp 9−, 1 at Kp 9 1989: 2 days at Kp 9 1991: 5 days at Kp 9− 1992: 1 day at Kp 9− 1998: 1 day at Kp 9− 2000: 1 day at Kp 9, 1 more at 9− 2000: 1 day at Kp 9−, 1 at Kp 9 2001: 2 days at Kp 9− 2003: 2 days at Kp 9, 1 more at 9− 2003: 1 day at Kp 9−, 2 at Kp 9 2004: 4 days at Kp 9− 2005: 1 day at Kp 9− 2024: 1 day at Kp 9, 2 more at 9− 2024: 2 days at Kp 9−, 1 at Kp 9 2025: 1 day at Kp 9− 2026: 1 day at Kp 9− 1940 1950 1960 1970 1980 1990 2000 2010 2020 1948: no day at Kp 9 or 9− 1946

Days in the year

Our analysis of GFZ’s Kp index, the planetary measure of geomagnetic disturbance in each three hours, from 1932 to October 26, 2026; the newest values are preliminary. Kp from Geomagnetic Observatory Niemegk, GFZ Helmholtz Centre for Geosciences, CC BY 4.0 [14]. NOAA’s levels follow our guide’s section 7. Hover or tap a bar for its value.

The five largest sunspot groups in the Greenwich record, 1874–1976, all in cycle 18

PeakArea, millionths of the Sun’s hemisphereCycle
April 8, 19476,13218
February 7, 19465,20218
May 19, 19514,86518
July 29, 19464,72018
March 12, 19474,55418

Our analysis: each group’s largest daily area, corrected for foreshortening, in the Royal Greenwich Observatory’s records as compiled by NASA’s Marshall Space Flight Center [15]. The largest group after 1976, in the US Air Force and NOAA data that continue the record, peaked at 3,600 millionths on March 17, 1989, or 5,040 with the factor of 1.4 that NASA applies to compare the two sources [15]. The counts and ranks in this section are re-run by record_numbers.py, under Code and numbers.

Our analysis

“Killer storms every 89 years”: False

Gleissberg described a rise and fall of the sunspot maxima “about seven or eight sun-spot cycles” long [7 p. 159]; later work gives “a mean period of about 90 years” within “a varying timescale of 60–140 years” [8 §2.4.1], two bands [9 Abstract], 87.8 years in radiocarbon [10 Abstract], or no true cycle at all [11 Abstract]. So the presenter’s period is about right, though we found no source for 88.8 years. What fails is a cycle “for killer events”. Hayakawa and colleagues related the 1770 storm’s timing to “the apparent 60−100-year period of extreme solar flares” [6 §5], but their source gives a frequency, not a cycle: storms below −500 nT “occur approximately every 50 years” [43 note 2]; a 2011 paper whose title links extreme storms to “recent Gleissberg cycles” we could not read [12]. Neither is a regular 89-year clock, and the record runs against one. After 1859, the Carrington-class storms of 1872 and 1921 came 12.6 and 26.9 years from an 89-year mark, and the 1948 mark brought none: no day with Kp 9 [14], and nothing near 1859’s size, as our check of the paper found. That check’s tests against random dates show no excess at the marks, as the record would lead one to expect.

Our analysis

“1948: Kp 9 storms, record spots”: Partly true

Cycle 18 was one of the stronger cycles: its smoothed maximum, 218.7 in May 1947, ranks 8th of 25, and 1948’s yearly mean, 193.0, ranks 20th of 326 years [13]. Its sunspots were the largest on record: the five largest groups in the Greenwich record of 1874–1976 all came in it [15]. But “lots of KP9 events” fails. GFZ’s record, which begins in 1932, has no day with Kp 9 in 1948; its highest was 8+, on March 15 and October 17–18 [14]. Cycle 18 had two Kp 9 days, July 27 and September 22, 1946: fewer than cycles 17, 19, 20, 21 and 23, against an average of 3.25 for cycles 17–24. Counting the days at 9− as well, it had 13, tied with cycle 23 for second of the eight complete cycles since 1933 and above their average of about 10 [14]. Its largest storm, on March 28, 1946, at Kp 9− the eighth-largest day since 1932 by the daily Ap index, came two years before the 1948 mark: the one storm near a mark in our check of the paper, and far smaller than 1859’s [14]. Nothing near 1948 approached the storms of 1770 or 1859.

The 89-year steps are eight 11-year cycles; the step to 1948 lands on a busy Sun with giant sunspots, and no storm at the top of the scale.

5 · Cycle 26

A cycle forecast to peak around 2035, no stronger than the last

“One more 88-year jump takes us to 2037 2038 area. That’s the next solar cycle from right now. The one I’ve already said we’re not going to make it through.” [1 00:01:50–00:02:02]

Cycle 25’s peak

160.9

In October 2024, 13-month smoothed: 15th of 25 cycles, against 285.0 for cycle 19 [13].

Cycle 26, NASA’s mean cycle

161.2

Peaking in December 2034 (5–95%: 60.3–276.2), falling to about 120 in January 2037 and 88 in January 2038 [19].

A storm like 1859’s, within a decade

0.92–12%

Nine published estimates on our guide, from the lowest [22] to the highest [21 Abstract]; none of them sets a date.

Forecasts for cycle 26

ForecastPeak sunspot numberWhenMeasure
Zermane et al. (2025), MSODA [16 Abstract]109.14 ± 32.922035.3 ± 2.3Sunspot number
Zermane et al. (2025), MXSODA, “the most reliable indicator” [16 Abstract]160.70 ± 47.832035.3 ± 2.3Sunspot number
Kalkan et al. (2026), machine learning [17 Abstract]109July 2034“11 yr, monthly averaged”
Abdel Rahman and Eid (2026), a statistical model [18]179.3 (95%: 161.4–197.2)March 2035Monthly mean; cycle 25’s was about 216
NASA Marshall Space Flight Center, October 2026 [19]161.2December 203413-month smoothed; “a mean cycle”, not a forecast of this one
Cycle 25, observed [13]160.9October 202413-month smoothed

The measures differ: a monthly mean runs higher than a 13-month smoothed value. Abdel Rahman and Eid list seven values for cycle 26, their own and NASA’s among them, from about 118 to 194, with maxima “between mid-2034 and late-2036” [18]. NOAA: “Solar Cycle 26 is expected to begin some time between January 2029 and December 2032. We do not yet produce a prediction for Solar Cycle 26.” [20]

Our analysis

“A brutal cycle we won’t survive”: Unsupported

The timing holds: 2037–38 falls in cycle 26, after its expected peak [19][20]. Nothing else does. The forecasts in the table put cycle 26 near or below cycle 25 [16 Abstract][18 Abstract], and none can say when a big storm will come; larger cycles raise the odds without setting dates, as our check of the 1770 paper notes. For a storm as large as 1859’s, the nine estimates on our guide run from 0.92% [22] to about 12% [21 Abstract] a decade. The 1770 paper’s own model, at its higher bar of −1,025 nT, gives about 0.7% a decade (our conversion) [2 Abstract]; at the −850 nT the guide’s estimates mostly use it gives 2.6%, inside their range, as our check of the paper found. For a storm like 1770’s it would give about 0.08% a cycle, a rarity that check rates Overstated. Even the worst-case damage scenarios on the guide count recovery in years, not an end. And “the math” of the line-up [1 00:00:21] is the presenter’s arithmetic (section 4), not the paper’s, which says nothing about cycle 26 or 2037 [2]. It is a forecast, so it is not strictly disproven: Unsupported.

6 · The Sun

Eruptions off the limbs, nothing aimed at Earth, and a coronal hole at the centre of the disk

“in the last 24 hours on the sun were quiet but only on the earth facing helioraphic longitudes. Limb eruptions and farside cmemes were popping for half the day. Nothing aimed our way. Coronal hole and filaments are facing us directly today.” [1 00:00:30–00:00:43]

In the forecasters’ words

From the Space Weather Prediction Center’s Forecast Discussion and SIDC’s daily bulletin; times are UTC, and the episode went up at 12:22 on October 27.

“Newly numbered Region 4561 (S11W77, Dai/beta) produced low level C-class flare activity to include a long duration C2.8 AT 26/1840 UTC, which was the largest event of the period. This region also produced two CMEs, but neither are considered Earth-directed considering their origin.”

SWPC, October 27, 0030 UTC, the last before the episode [23]

“Low-level C-class flaring was also produced by SIDC Sunspot Group 985 (NOAA Active Region 4560) from behind the west limb.” … “A positive polarity equatorial coronal hole reached the central meridian on the evening of October 26.”

SIDC, October 27, 12:31 UTC [29]

“Other activity included a filament eruption centered near N30E75 that lifted off at approximately 26/2142 UTC. Preliminary analysis showed the potential for glancing effects arriving early on 31 Oct.”

SWPC, October 27, 1230 UTC, seven minutes after the episode [23]

Flares, 24 hours before the upload

Our analysis

8

In GOES-18’s list, 6 of class B and 2 of class C, the largest a C2.8 at 18:40 UTC on October 26; none of class M in the whole week [26].

Coronal mass ejections, same 24 hours

2

Leaving to the west-south-west and the north-east, at 341 and 265 km/s, neither a halo [30].

The coronal hole

CH 07

Positive polarity, across the central meridian in SWPC’s synoptic analysis of 05:56 UTC on October 27 [27].

The flares and coronal mass ejections of October 26, 12:22, to October 27, 12:22 UTC
Peak or onset, UTCEventWhereNote
Oct 26, 13:58B6.0 flareRegion 4561
Oct 26, 17:36B9.4 flareRegion 4560Already past the west limb
Oct 26, 18:36CME 0018West-south-west limb, 52° wideMedian 341 km/s, no halo
Oct 26, 18:40C2.8 flareRegion 4561, S13W73Long duration; an optical subflare
Oct 26, 20:22B8.4 flareRegion 4561
Oct 26, 21:00CME 0019North-east limb, 76° wideMedian 265 km/s, no halo; perhaps the filament eruption near N30E75 that SWPC dates to about 21:42
Oct 26, 22:02B4.7 flareRegion 4561
Oct 27, 02:48C1.1 flareRegion 4560From behind the west limb
Oct 27, 05:18B3.9 flareRegion 4561
Oct 27, 09:32B3.7 flareRegion 4561

Flares from GOES-18’s list with their regions from the Center’s edited events, which add a B4.2 seen by GOES-19 at 03:26 [26][25]; CMEs from CACTus’s automated detections in SOHO/LASCO images, whose list ends with images of 06:42 (LASCO C3) and 10:24 (C2) on October 27 [30]; the filament eruption from the Center’s discussion [23]. Matching CME 0019 to that eruption is our tentative reading, from its direction: the CME’s onset, 21:00, comes 42 minutes before the lift-off SWPC gives.

Our analysis

“Limb eruptions, nothing at us”: True

Every part but one checks out. “Quiet … on the earth facing … longitudes”: the two C-class flares came from Region 4561 at the west limb, S13W73, and from Region 4560, already behind it [25][29], while Region 4562, on the eastern half of the disk at S17E49, “remained stable and relatively quiet” [23][24]; activity overall was at “low levels” [24]. “Limb eruptions”: the two CMEs in the window left to the west-south-west at 18:36 UTC, around the time of the C2.8 flare, and to the north-east at 21:00, perhaps from the filament eruption at N30E75 [30][23]. “Farside” is the exception: SIDC saw flaring “from behind the west limb” [29], but we found no catalogued CME from the far side in the window, and SWPC’s “Other coronal activity … near or beyond the NE limb” was in the day before it [23]. “Nothing aimed our way”: neither of Region 4561’s CMEs was “considered Earth-directed”, and “No Earth-directed CMEs were identified in available coronagraph imagery during the day” [23]; SIDC saw “No Earth-directed CMEs” either [29]. Seven minutes after the upload, SWPC gave the north-east filament eruption “the potential for glancing effects arriving early on 31 Oct” [23]. “Coronal hole and filaments are facing us”: SWPC’s synoptic analysis shows a large positive coronal hole across the central meridian and filaments on the Earth-facing disk [27]; its fast wind “may begin influencing the near-Earth environment from October 30”, SIDC said [29], and SWPC’s outlook has a minor (G1) storm on October 31 from recurrent coronal-hole streams [28]. The gist holds, activity at and behind the limbs, nothing aimed at Earth and a coronal hole facing it, so True.

Code and numbers

Run them

Both scripts need only Python 3. Keep the three CSV files in the script’s folder and run python3 -I sun_window.py; NOAA’s flare list rolls over, so these extracts, made on October 27 at about 16:30 UTC, are the record we used [26][25]. python3 -I record_numbers.py downloads about 11 MB of public files the first time: GFZ’s Kp (CC BY 4.0) [14], SILSO’s table of cycles (CC BY-NC 4.0) [13] and NASA’s Greenwich records [15].

7 · The cyclone

Very severe cyclonic storm Arnab, forecast as he said; a storm heading north in one model of fourteen

“That cyclone is going to slam into India today and it is not going to be fun. Several of the critical flood risk areas are taking the fury of the sky at dangerous levels for nearly 24 straight hours as the cyclone creeps northward.” [1 00:00:47–00:00:59] It is the storm, BOB 08/2026, that our review of the October 24 episode left forecast to cross the coast on October 28.

Arnab, October 24 to 28, in UTC

Our analysis
  • The storm, in IMD’s and JTWC’s records
  • Forecast landfall
  • The episode goes up
Categories and winds from the India Meteorological Department’s observed and forecast track of 03:00 UTC on October 27, which we cite rather than reproduce [35], and its bulletins [31][34]; the Joint Typhoon Warning Center’s winds are one-minute averages, and its satellite estimate differed from IMD’s: T6.0, 115 knots, against T4.5, 77 knots [38]. Times converted by us (Our analysis).

In the India Meteorological Department’s words

At 17:15 IST, 38 minutes before the episode, the department’s bulletin No. 19 carried a “Red Message” for Andhra Pradesh and south Odisha: Arnab was “very likely to move nearly west-northwestwards during next few hours, then northwestwards and cross Andhra Pradesh & Yanam coasts between Bapatla and Visakhapatnam, close to south of Yanam as a very severe cyclonic storm with the maximum sustained wind speed of 125-135 kmph gusting to 150 kmph by forenoon of 28th October, 2026” [31]. For coastal Andhra Pradesh it forecast “heavy to very heavy (7-20 cm) rainfall at a few places and extremely heavy rainfall (>= 21 cm) at isolated places … on 27th & 28th October”, with extremely heavy rain also over south Odisha and, on the 28th, south Chhattisgarh, and gales in eight coastal districts, from Anakapalli and Visakhapatnam to Konaseema, Krishna and Bapatla [31]. Its advisory to neighbouring countries added a storm surge of “1.5 to 2.5 m” near Kakinada and Yanam [32], and the press release “Riverine flooding, Urban flooding, coastal flooding, possible landslides in hilly areas” [33]. At 21:30 IST, bulletin No. 20: “Due to faster movement, the landfall of cyclone is expected early. It is likely to make landfall during early hours (2-4 AM) of 28th October.” [31]

The Joint Typhoon Warning Center, the second source

In its warning of 15:00 UTC, after the episode, the center put Tropical Cyclone 02B at 120 knots in one-minute winds at 12:00 UTC, just past a peak near 10:00 UTC, with landfall “ALONG THE SOUTHWESTERN COAST OF THE GODAVARI RIVER DELTA BY TAU 12”, that is, by about midnight UTC [38]. It expected the storm to slow near the coast, “CAUSING A BRIEF STALL ALONG THE GODAVARI DELTA COASTLINE”, and then to turn north and fall apart over land within two days [38]. After landfall, IMD’s forecast track runs north across Telangana and Chhattisgarh into eastern Madhya Pradesh and Uttar Pradesh by October 30, at about 16 km/h [32].

Our analysis

“Cyclone slams into India today”: True

He relayed the forecast faithfully. “Slam” fits a very severe cyclonic storm under a Red Message, crossing at 125–135 km/h [31]. “Today” is right where he was: at the upload it was 5:22 a.m. on October 27 in Arizona and 17:52 in India, and IMD’s landfall, first due by the forenoon of the 28th in India, 08:00–12:00 IST by its definition [44], then at 2–4 a.m. that day, fell on October 27 in Arizona either way, and in UTC by the later forecast [31][34]. The warnings ran over two days of extremely heavy rain on the coast, so “nearly 24 straight hours” is if anything short [31]; heavy rain had begun, with 147.5 mm at Yellamanchilli by 21:30 IST [34]. “Creeps northward” matches the track after landfall [32]. Much as forecast, IMD reported that Arnab crossed the Andhra Pradesh and Yanam coasts south-west of Yanam, about 20 km east-northeast of Narsapur, between 02:00 and 08:00 IST on October 28, 20:30 UTC on the 27th to 02:30 UTC, as a very severe cyclonic storm with sustained winds of 125–135 km/h, gusting to 150 [45][46]. It then moved north, weakening to a cyclonic storm by 12:00 UTC, a deep depression by 18:00 UTC and a depression over south Chhattisgarh by 00:00 UTC on October 29 [47]; at 11:30 IST that day it lay over central Chhattisgarh, 110 km south of Raipur, forecast to weaken into a well-marked low that evening [48]. IMD listed up to 26 cm of rain in coastal Andhra Pradesh in the 24 hours to 08:30 IST on October 28, at Garividi, and 22 cm at Visakhapatnam [45]; in the next 24 hours, “Exceptional heavy rainfall occurred over south Odisha”, with 546 mm at Patrapur in Ganjam district [47]. On October 29 the Press Trust of India, quoting the managing director of Andhra Pradesh’s State Disaster Management Authority, put the state’s toll at six [49]; that is a news report, not a final official count.

“The type of storm that causes India’s most severe short-term disasters”: Context

“This is the type of storm that causes India’s most severe short-term disasters” [1 00:00:59–00:01:02]. There is a basis. India’s national guidelines on cyclones note that “since 1737, 21 of the 23 major cyclone disasters (in terms of loss of lives) in the world have occurred over the Indian subcontinent (India and Bangladesh)”, and that “storm surge is responsible for 90% of the loss of lives associated with cyclone disaster” [40 p. 1]. What the line leaves out is the trend the guidelines see the world over: “even though damage to property is continuously increasing loss of life shows a declining trend”, because of an “improved early warning system and dissemination” and better preparedness [40 p. 1].

Our analysis

“Another storm tossed out of the same island region that instead wants to head north”: Unconfirmed

“there will be another storm tossed out of the same island region that instead wants to head north” [1 00:01:05–00:01:10]. The presenter did not name it. Arnab’s parent was a circulation “over southeast & adjoining eastcentral Bay of Bengal and Andaman Islands” on October 22 [36 p. 4], so the island region is most likely the Andamans, and the department’s outlook of that day also expected that “An upper air cyclonic circulation is likely to form over Southeast Bay of Bengal during the first half of week 2” [36 p. 4], with a 30–40% chance of a depression over the south-east Bay and the Andamans that week and 20–30% over the north-west Bay [36 p. 3]. Its summary of fourteen forecast models, issued at 09:00 UTC on October 27, before the episode, has a new circulation emerging into the south Andaman Sea in thirteen of them [37 pp. 3–4]. Five develop it and bring it to the Andhra or Odisha coast around November 1; two move it “north-northwestwards”, and only NCEP’s GFS takes it on to “cross WB-Bangladesh coast as SCS”, a severe cyclonic storm; three move it west “with marginal intensification”; four let it become “less marked”; and one shows none [37 pp. 3–4]. After the episode, the Joint Typhoon Warning Center added a disturbance in the central Bay, Invest 90B, “RAPIDLY DEVELOPING” and “MOVING RAPIDLY NORTHWARD” [38]; its advisory gave it a “LOW” chance of becoming a significant cyclone within a day, with “LIMITED DEVELOPMENT, EXCEPT FOR THE GFS”, which made it a cyclone “IN LESS THAN 24 HOURS BEFORE MAKING LANDFALL IN NORTHEASTERN INDIA” [39]. A new circulation in the south-east Bay was expected; a storm out of it heading north was, at the episode, one or two models’ solution. What becomes of it will go in the change log.

The cyclone forecast was relayed correctly; the second storm heading north was, before the episode, one model’s solution (two moved it north-northwest).

8 · Limits

Where this check could be wrong

What would change these verdicts

  1. 01

    A well-dated list of extreme storms on which an 88–89-year spacing beats random dates, under rules fixed in advance, as our test of a claimed 6,000-year cycle requires.

  2. 02

    A forecast, from the Sun’s polar fields or a dynamo model, of an exceptionally strong cycle 26 [20].

  3. 03

    Revised SWPC or SIDC records for October 26–27 [23][29].

Still to come: Arnab’s final toll, and what becomes of the low that formed over the south Andaman Sea on October 29, which IMD expected to become a depression around October 31 [47].

Sources

Bracketed numbers refer to this list. For the episode [1], times are positions in the video (hours:minutes:seconds), from the first to the last line of its automatically generated transcript that holds the words quoted. For the papers, Abstract names the part we used, § a section and p. a page as printed; for the India Meteorological Department’s report, p. is a page of the PDF. The times of NOAA’s, SIDC’s and the Joint Typhoon Warning Center’s products are UTC; the India Meteorological Department’s are IST, five and a half hours ahead. The episode went up at 12:22 UTC on October 27, 2026. We read the sources on October 27, 2026, between 16:10 and 18:00 UTC, and sources 45–49, on Arnab’s landfall, on October 29. Links checked October 27, 2026.

  1. 1

    SpaceWeatherNews (S0) (October 27, 2026). The LONG Sun Cycle: 2037 Superflare | S0 News Oct.27.2026. YouTube video, https://www.youtube.com/watch?v=AAjL4LxiktY, published 12:22 UTC, 3 minutes 33 seconds, with its description as read on October 27, 2026. Quoted from the automatically generated transcript; times are positions in the video.

  2. 2

    Yuan, D., Yin, T., Xu, X., Wang, B., Srivastava, A. K., Poedts, S., Nakariakov, V. M., Feng, X., Chen, W., and Luo, D. (2026). The Qianlong XXXV event: a potential benchmark for extreme geomagnetic storms based on historical Chinese auroral archives. Frontiers in Astronomy and Space Sciences 13, 1857812, published October 21, 2026. Peer reviewed; open access, CC BY 4.0. The episode’s link “1770 Solar Superstorm”. We read the full text on the publisher’s page; § gives a section. Checked on its own page.

  3. 3

    Griv, E., and Yahalom, A. (2026). Generation of spiral bending waves in a rotating galactic stellar disk of finite thickness. Astrophysics and Space Science 371(10), 118, published October 8, 2026. Peer reviewed; open access, CC BY 4.0. The episode’s link “Galactic Corrugation”. Abstract, as deposited with Crossref; read in full for our check of the paper.

  4. 4

    Willis, D. M., Stephenson, F. R., and Singh, J. R. (1996). Auroral Observations on AD 1770 September 16: the Earliest Known Conjugate Sightings. Quarterly Journal of the Royal Astronomical Society 37, 733–742. As read for our check of the 1770 paper; p. gives a page as printed.

  5. 5

    Kataoka, R., and Iwahashi, K. (2017). Inclined Zenith Aurora over Kyoto on 17 September 1770: Graphical Evidence of Extreme Magnetic Storm. Space Weather 15(10), 1314–1320. Title and record, from Crossref.

  6. 6

    Hayakawa, H., Iwahashi, K., Ebihara, Y., Tamazawa, H., Shibata, K., Knipp, D. J., Kawamura, A. D., Hattori, K., Mase, K., Nakanishi, I., and Isobe, H. (2017). Long-lasting Extreme Magnetic Storm Activities in 1770 Found in Historical Documents. The Astrophysical Journal Letters 850(2), L31. As read for our check of the 1770 paper; § gives a section.

  7. 7

    Gleissberg, W. (1939). A long-periodic fluctuation of the sun-spot numbers. The Observatory 62, 158–159. As read for our check of the 1770 paper; p. gives a page.

  8. 8

    Usoskin, I. G. (2023). A history of solar activity over millennia. Living Reviews in Solar Physics 20, 2. Open access, CC BY 4.0. We read the full text; § gives a section.

  9. 9

    Ogurtsov, M. G., Nagovitsyn, Yu. A., Kocharov, G. E., and Jungner, H. (2002). Long-Period Cycles of the Sun’s Activity Recorded in Direct Solar Data and Proxies. Solar Physics 211, 371–394. Abstract only.

  10. 10

    Peristykh, A. N., and Damon, P. E. (2003). Persistence of the Gleissberg 88-year solar cycle over the last ∼12,000 years: Evidence from cosmogenic isotopes. Journal of Geophysical Research: Space Physics 108(A1). Abstract only.

  11. 11

    Cameron, R. H., and Schüssler, M. (2019). Solar activity: periodicities beyond 11 years are consistent with random forcing. Astronomy & Astrophysics 625, A28. CC BY 4.0. Abstract only.

  12. 12

    Gonzalez, W. D., Echer, E., Clúa de Gonzalez, A. L., Tsurutani, B. T., and Lakhina, G. S. (2011). Extreme geomagnetic storms, recent Gleissberg cycles and space era-superintense storms. Journal of Atmospheric and Solar-Terrestrial Physics 73(11–12), 1447–1453. Not read: its publisher showed a CAPTCHA, which we did not attempt, and the repository copy could not be reached.

  13. 13

    WDC-SILSO, Royal Observatory of Belgium, Brussels. Solar Cycles Min/Max, from the 13-month smoothed monthly total sunspot number, and the yearly mean total sunspot number, version 2.0. CC BY-NC 4.0: used here non-commercially, with credit. Read October 27, 2026.

  14. 14

    Matzka, J., Stolle, C., Yamazaki, Y., Bronkalla, O., and Morschhauser, A. (2021). The geomagnetic Kp index and derived indices of geomagnetic activity. Space Weather 19, e2020SW002641. Data: Matzka, J., Bronkalla, O., Tornow, K., Elger, K., and Stolle, C. (2021). Geomagnetic Kp index, V. 1.0, GFZ Data Services, as of October 26, 2026. Kp from Geomagnetic Observatory Niemegk, GFZ Helmholtz Centre for Geosciences, CC BY 4.0; the newest values are nowcasts.

  15. 15

    Hathaway, D. H., NASA Marshall Space Flight Center. Royal Observatory, Greenwich – USAF/NOAA Sunspot Data: daily records of sunspot groups, 1874–2013, from the Royal Greenwich Observatory to 1976 and the US Air Force and NOAA after, with their format description. Read October 27, 2026.

  16. 16

    Zermane, M. A., Oulebsir, N., Bekli, M. R., Belhadi, Z., Becheker, K., Zaidi, A., and Hadj Hammou, A. (2025). Magnitude Prediction of Solar Cycle 26 Using a New Precursor Approach. Solar Physics 300, 53. Abstract only.

  17. 17

    Kalkan, M. Y., Fawzy, D. E., and Cuntz, M. (2026). Forecasting Solar Cycle 26 with Multiple Machine Learning Techniques. Publications of the Astronomical Society of the Pacific 138, 044502. CC BY 4.0. Abstract only.

  18. 18

    Abdel Rahman, H. I., and Eid, D. (2026). Long-memory modeling and forecasting of monthly mean sunspot numbers for cycles 25 & 26 using ARFIMA model. Scientific Reports 16, 19381. CC BY 4.0. We read the full text, including its Table 4 of published forecasts.

  19. 19

    NASA Marshall Space Flight Center (October 2026). Estimates of 13-month smooth solar activity for balance of cycle 25 with a mean cycle given for cycle 26, its Table 4: sunspot number and Ap index with their 5% and 95% percentiles, April 2026 to October 2041. Read October 27, 2026.

  20. 20

    NOAA Space Weather Prediction Center. Solar Cycle Progression. Read October 27, 2026.

  21. 21

    Riley, P. (2012). On the probability of occurrence of extreme space weather events. Space Weather 10, S02012. Abstract only; as read for our guide to Earth’s weakening field.

  22. 22

    Moriña, D., Serra, I., Puig, P., and Corral, Á. (2019). Probability estimation of a Carrington-like geomagnetic storm. Scientific Reports 9, 2393. CC BY 4.0; as read for our guide to Earth’s weakening field.

  23. 23

    NOAA Space Weather Prediction Center (October 26–27, 2026). Forecast Discussion, the issues of October 26 (1230 UTC) and October 27 (0030 UTC, the last before the episode, and 1230 UTC, seven minutes after it), from the Center’s archive (ftp.swpc.noaa.gov, pub/forecasts/discussion/). Read October 27, 2026.

  24. 24

    NOAA Space Weather Prediction Center and US Air Force (October 26–27, 2026). Report and Forecast of Solar and Geophysical Activity no. 299 (October 26, 2200 UTC) and Solar Region Summary no. 300 (October 27, 0030 UTC), from the archive (pub/forecasts/RSGA/ and SRS/). Read October 27, 2026.

  25. 25

    NOAA Space Weather Prediction Center. Edited Events for October 26 and 27, 2026, from the archive (pub/indices/events/), as updated at 15:27 and 16:12 UTC on October 27; their X-ray, optical-flare and radio-burst lines are in swpc-events-2026-10-26-27.csv.

  26. 26

    NOAA Space Weather Prediction Center. GOES-18 X-ray flare list, last 7 days (October 20, 18:36, to October 27, 09:32 UTC), read October 27, 2026, 16:33 UTC. The file rolls over; the version used is in goes18-flares-2026-10-20-27.csv.

  27. 27

    NOAA Space Weather Prediction Center. Solar Synoptic Analysis of October 27, 2026, 05:56 UTC, the forecasters’ hand-drawn map of the day’s sunspot regions, filaments, plage and coronal holes, as served on October 27.

  28. 28

    NOAA Space Weather Prediction Center (October 26, 2026). Weekly Highlights and Forecasts and 27-day Space Weather Outlook Table, both issued 0118 UTC. Read October 27, 2026.

  29. 29

    Solar Influences Data Analysis Center (SIDC), Royal Observatory of Belgium (October 27, 2026). URSIgram 61027, its daily bulletin, issued 12:31 UTC. Read October 27, 2026.

  30. 30

    SIDC, Royal Observatory of Belgium. CACTus, the list of coronal mass ejections it detects in SOHO/LASCO C2 and C3 images, October 21–27, 2026, issued October 27, 13:55 UTC; the list is in cactus-cmes-2026-10-21-27.csv. SOHO is a mission of ESA and NASA.

  31. 31

    India Meteorological Department (October 26–27, 2026). National Bulletins on BOB/08/2026, “Arnab”: No. 8 (issued 09:30 IST, October 26), No. 14 (02:30 IST, October 27), No. 19 (17:15 IST, October 27, the last before the episode) and No. 20 (21:30 IST, October 27), from the Regional Specialised Meteorological Centre, New Delhi. Read October 27, 2026.

  32. 32

    India Meteorological Department, RSMC New Delhi (October 27, 2026). Tropical Cyclone Advisory No. 12 for the WMO/ESCAP Panel’s member countries, issued 1200 UTC.

  33. 33

    India Meteorological Department (October 27, 2026, 1400 IST). Press Release-5: Very Severe Cyclonic Storm “Arnab” over Westcentral Bay of Bengal.

  34. 34

    India Meteorological Department (October 27, 2026). Hourly updates on very severe cyclonic storm “Arnab”, No. 02 (issued 21:30 IST) and No. 03 (22:00 IST).

  35. 35

    India Meteorological Department (October 27, 2026). Observed and forecast track along with cone of uncertainty of very severe cyclonic storm ‘Arnab’, based on 0300 UTC of October 27, 2026. Cited, not reproduced.

  36. 36

    India Meteorological Department (October 22, 2026). Extended Range Outlook for cyclogenesis over the North Indian Ocean, October 23 to November 5, 2026.

  37. 37

    India Meteorological Department, Cyclone Warning Division (October 27, 2026, 0900 UTC). Tropical Cyclone Forecast Programme Report; p. gives a page of the PDF.

  38. 38

    Joint Typhoon Warning Center (October 27, 2026). Tropical Cyclone 02B (Arnab) Warning Nr 007, 271500Z, with its prognostic reasoning and track file. Read October 27, 2026.

  39. 39

    Joint Typhoon Warning Center (October 27, 2026). Significant Tropical Weather Advisory for the Indian Ocean, reissued 271330Z. Read October 27, 2026.

  40. 40

    National Disaster Management Authority, Government of India (2008). National Disaster Management Guidelines: Management of Cyclones, as hosted by RSMC New Delhi. Read in part (Chapter 1); p. gives a page as printed.

  41. 41

    Alfvén, H., and Carlqvist, P. (1978). Interstellar clouds and the formation of stars. Astrophysics and Space Science 55(2), 487–509. Cited for the date of the idea, as in stop 14 of our video check; not read here.

  42. 42

    Observer Courses (Podia). The Roadmap and Phoenix Rising, product pages. Read October 27, 2026, for the promotion only; the products are not rated.

  43. 43

    Cliver, E. W., and Dietrich, W. F. (2013). The 1859 space weather event revisited: limits of extreme activity. Journal of Space Weather and Space Climate 3, A31. Its note 2 as read for our check of the 1770 paper; the journal’s site showed our tools a bot check, which we did not bypass.

  44. 44

    India Meteorological Department, RSMC New Delhi. Terminology, its glossary of the terms used in cyclone bulletins, which gives “Forenoon: 0800 - 1200 HRS. IST”. Read October 27, 2026.

  45. 45

    India Meteorological Department (October 28, 2026, 1430 IST). Press Release-6: Severe Cyclonic Storm “Arnab” over Coastal Andhra Pradesh & Yanam and adjoining Westcentral Bay of Bengal, which reports the landfall, with its annexure of rainfall in the 24 hours to 08:30 IST. Read October 29, 2026.

  46. 46

    India Meteorological Department, RSMC New Delhi (October 28, 2026). Tropical Cyclone Advisory No. 18 for the WMO/ESCAP Panel’s member countries, issued 0700 UTC, based on 0300 UTC, which gives the landfall in UTC. Read October 29, 2026.

  47. 47

    India Meteorological Department (October 29, 2026, 1430 IST). Press Release-7: (A) Depression (Remnant of Very Severe Cyclonic Storm “Arnab”) over south Chhattisgarh and adjoining south Odisha and (B) Low Pressure Area over South Andaman Sea and neighbourhood. Read October 29, 2026.

  48. 48

    India Meteorological Department (October 29, 2026, 1430 IST). National Bulletin No. 33 on BOB/08/2026, the remnant of “Arnab”, and the low over the south Andaman Sea, based on 11:30 IST; the latest national bulletin when read, at 15:43 UTC on October 29, 2026.

  49. 49

    Press Trust of India (October 29, 2026, 15:47 IST), via ThePrint. Arnab cyclone death toll rises to six in Andhra Pradesh, quoting the managing director of the Andhra Pradesh State Disaster Management Authority. A news report, not an official toll. Read October 29, 2026.
Method

How this was checked

On October 27, 2026, we checked every statement, number and quotation on this page against its source: the episode’s automatically generated transcript, quoted verbatim with its timestamps, and its description [1]; its two links and our checks of them, the 1770 storm paper read in full and the bending-wave paper in its abstract [2][3]; the earlier work on the 1770 storm, two papers as read for our check of the 1770 paper and one in its Crossref record [4]–[6]; the literature on the Gleissberg cycle, one paper of which we could not read [7]–[12]; WDC-SILSO’s dates of the sunspot cycles, GFZ’s Kp record and the Greenwich records of sunspot groups [13]–[15]; three forecasts for cycle 26, NASA’s mean cycle and NOAA’s statement on it [16]–[20]; two estimates of the odds of an extreme storm, as read for our guide [21][22]; the Space Weather Prediction Center’s discussions, reports, edited events, flare list, synoptic analysis and outlooks, SIDC’s daily bulletin and CACTus’s list of coronal mass ejections for October 26–27 [23]–[30]; the India Meteorological Department’s bulletins, advisory, press release, hourly updates, track, outlook and model report on Arnab, the Joint Typhoon Warning Center’s warning and advisory, and India’s national guidelines on cyclones [31]–[40], with the department’s glossary [44]; and the 1978 current-sheet paper, the promotion’s product pages and Cliver and Dietrich’s footnote [41]–[43]. In all, more than a hundred quoted passages and fragments, and every number on the page. The two links are checked on their own pages; nothing here re-rates them.

The verdicts and the items tagged “Our analysis” are our own assessment, built on the cited sources: the days with Kp 9 by year and by cycle, and 1948’s highest Kp, from GFZ’s record; the ranking of the sunspot cycles and of the largest sunspot groups; the mean length of a sunspot cycle and where the storms of 1770 and 1859 fall in theirs; the chances per decade and per cycle from the 1770 paper’s recurrence intervals; the flares and coronal mass ejections in the 24 hours before the upload; the cyclone’s forecast times in UTC, in India and in Arizona; and our reading of which system the second storm was. The two charts are drawn from GFZ’s and SILSO’s files, the timeline from the India Meteorological Department’s and the Joint Typhoon Warning Center’s products.

Re-run here: every count and time in sections 4 to 7, with the hosted record_numbers.py on GFZ’s, SILSO’s and NASA’s public files and sun_window.py on NOAA’s and SIDC’s records as extracted on October 27. Not repeated here: the test of the 89-year spacing against random dates, which is on our check of the 1770 paper. Not read: Gonzalez and colleagues (2011), whose publisher showed a CAPTCHA, and the full texts of the papers marked “Abstract only”; NASA’s DONKI database of coronal mass ejections could not be reached. Still to come when the page was published: Arnab’s landfall, added on October 29 from the India Meteorological Department’s two press releases, advisory and latest bulletin, with the toll from a Press Trust of India report [45]–[49].

After the page was built, a fresh reviewer who hadn’t seen the drafting re-ran both hosted scripts, which reproduced every number, and checked every quotation, locator, source and sister-page verdict. The changes that followed: the India Meteorological Department’s model summary is counted as fourteen models, not twelve, with the second storm taken north by one and north-northwest by two; Region 4562 is placed at S17E49, on the eastern half of the disk, not near its centre; the second claim now rests on the storm record, as on our check of the 1770 paper, and gives the Gleissberg cycle’s mean period of about 90 years; the 1948 claim quotes “lots of KP9 events” and gives cycle 18’s 13 days at Kp 9− or above; the 1770 paper’s 14,000 years is no longer a headline number; the storm is dated from a 1980 catalogue of Chinese aurorae, not from 1996; Cliver and Dietrich’s note is note 2; and some twenty smaller fixes of wording, timing and citations. No verdict changed.

This page was researched and written with Claude, an AI assistant made by Anthropic, and then re-checked against its sources in a separate verification pass.

The verdicts on this page

False
The evidence contradicts the claim.
Misread
Cites a real source but gets wrong what it says.
Unsupported
No evidence we could find backs it up, though it hasn’t been strictly disproven.
Partly true
Part of the claim holds up and part doesn’t.
True
The evidence supports the claim.

All ten verdicts, and how we check

Corrections

Corrections and changes

If we get something wrong, we fix it and record the change below with the date. If a correction changes a verdict, the log says what the old verdict was.

Change log

  1. Cyclone Arnab’s landfall added. The India Meteorological Department reported that Arnab crossed the Andhra Pradesh and Yanam coasts near Narsapur, south-west of Yanam, between 20:30 UTC on October 27 and 02:30 UTC on October 28 as a very severe cyclonic storm, with winds of 125–135 km/h gusting to 150, and that the second circulation became a low pressure area over the south Andaman Sea on October 29, expected to become a depression around October 31 and to move west-northwest toward the Andhra Pradesh coast; the claim-6 card, the timeline and sections 7 and 8 now say so, with a toll of six in Andhra Pradesh reported by the Press Trust of India (sources 45–49), and no verdict changes.
  2. Published on factchecked.science after a full check against the sources. Built from the episode’s transcript and description, its two links and our checks of them, the literature on the 1770 storm and the Gleissberg cycle, GFZ’s, SILSO’s and NASA’s records, three forecasts for cycle 26 and NASA’s mean cycle, the space weather centres’ records of October 26–27 and the India Meteorological Department’s bulletins on Cyclone Arnab, all read on October 27, 2026. A fresh review the same day changed no verdict: it led us to count all fourteen of IMD’s forecast models, to place Region 4562 correctly, to rest the 89-year claim on the storm record and to date the 1770 storm’s study from a 1980 catalogue, with some twenty smaller fixes.

Suggest a correction

Spotted an error, or know a better source? Tell us here. Submissions aren’t published.