Fact-Checked Science

Evidence review · S0 News, 28 October 2026

S0 News, October 28, 2026: Lumina simulates the first 2 billion years, not up to now

On October 28, 2026, S0 News called Lumina “the newest cosmological simulations”, showing where we stand in “being able to supercomput the universe from start to now” [1 00:01:23–00:01:37], and saw “No solar flares, no sunspots” [1 00:00:30–00:00:32]. Lumina’s full run ends at redshift 3 [5 Abstract][4], about 2.15 billion years after the Big Bang by our calculation [5 Table 2][8 §10]. Our paper checks cover the episode’s three other links; this page checks its Lumina, its Sun and its account of the storm of November 11, 2025 [1 00:01:55–00:02:07].

Our analysis marks our own reasoning and calculations, and the verdicts are our assessment. Everything else comes from the numbered sources. For the episode [1], times are positions in the video; for the papers, Abstract names the part we used, § a section, p. a page and Table a table. The space weather centres’ times are UTC.

Code and numbersDownload as PDFSourcesHow this was checkedCorrections

A nearly quiet Sun, a simulation of the first 2 billion years, and a 2025 storm described right

Our assessment

9

Our analysis: flares GOES-18 logged in the 24 hours before the upload, eight of class B and one C1.0, seven of them from a region rotating behind the Sun’s west limb [15][14]. None reached class M all week [15].

2.15 billion years

Our analysis: the age of the universe at redshift 3, where Lumina’s full run stops, by the simulation’s own parameters; 16% of the way from the Big Bang to today [5 Table 2][8 §10].

4

Our analysis: storms of this sunspot cycle that reached Kp 9− or more in GFZ’s record, in May and October 2024, November 2025 and January 2026. Only May 2024 reached Kp 9, NOAA’s G5 [29][36].

The episode’s claims

Partly true

No solar flares, no sunspots

“No solar flares, no sunspots. Plasma filaments are stable. That central coronal hole is likely to amplify solar wind conditions towards the end of the week, but that is also expected to be mild.” [1 00:00:30–00:00:41]

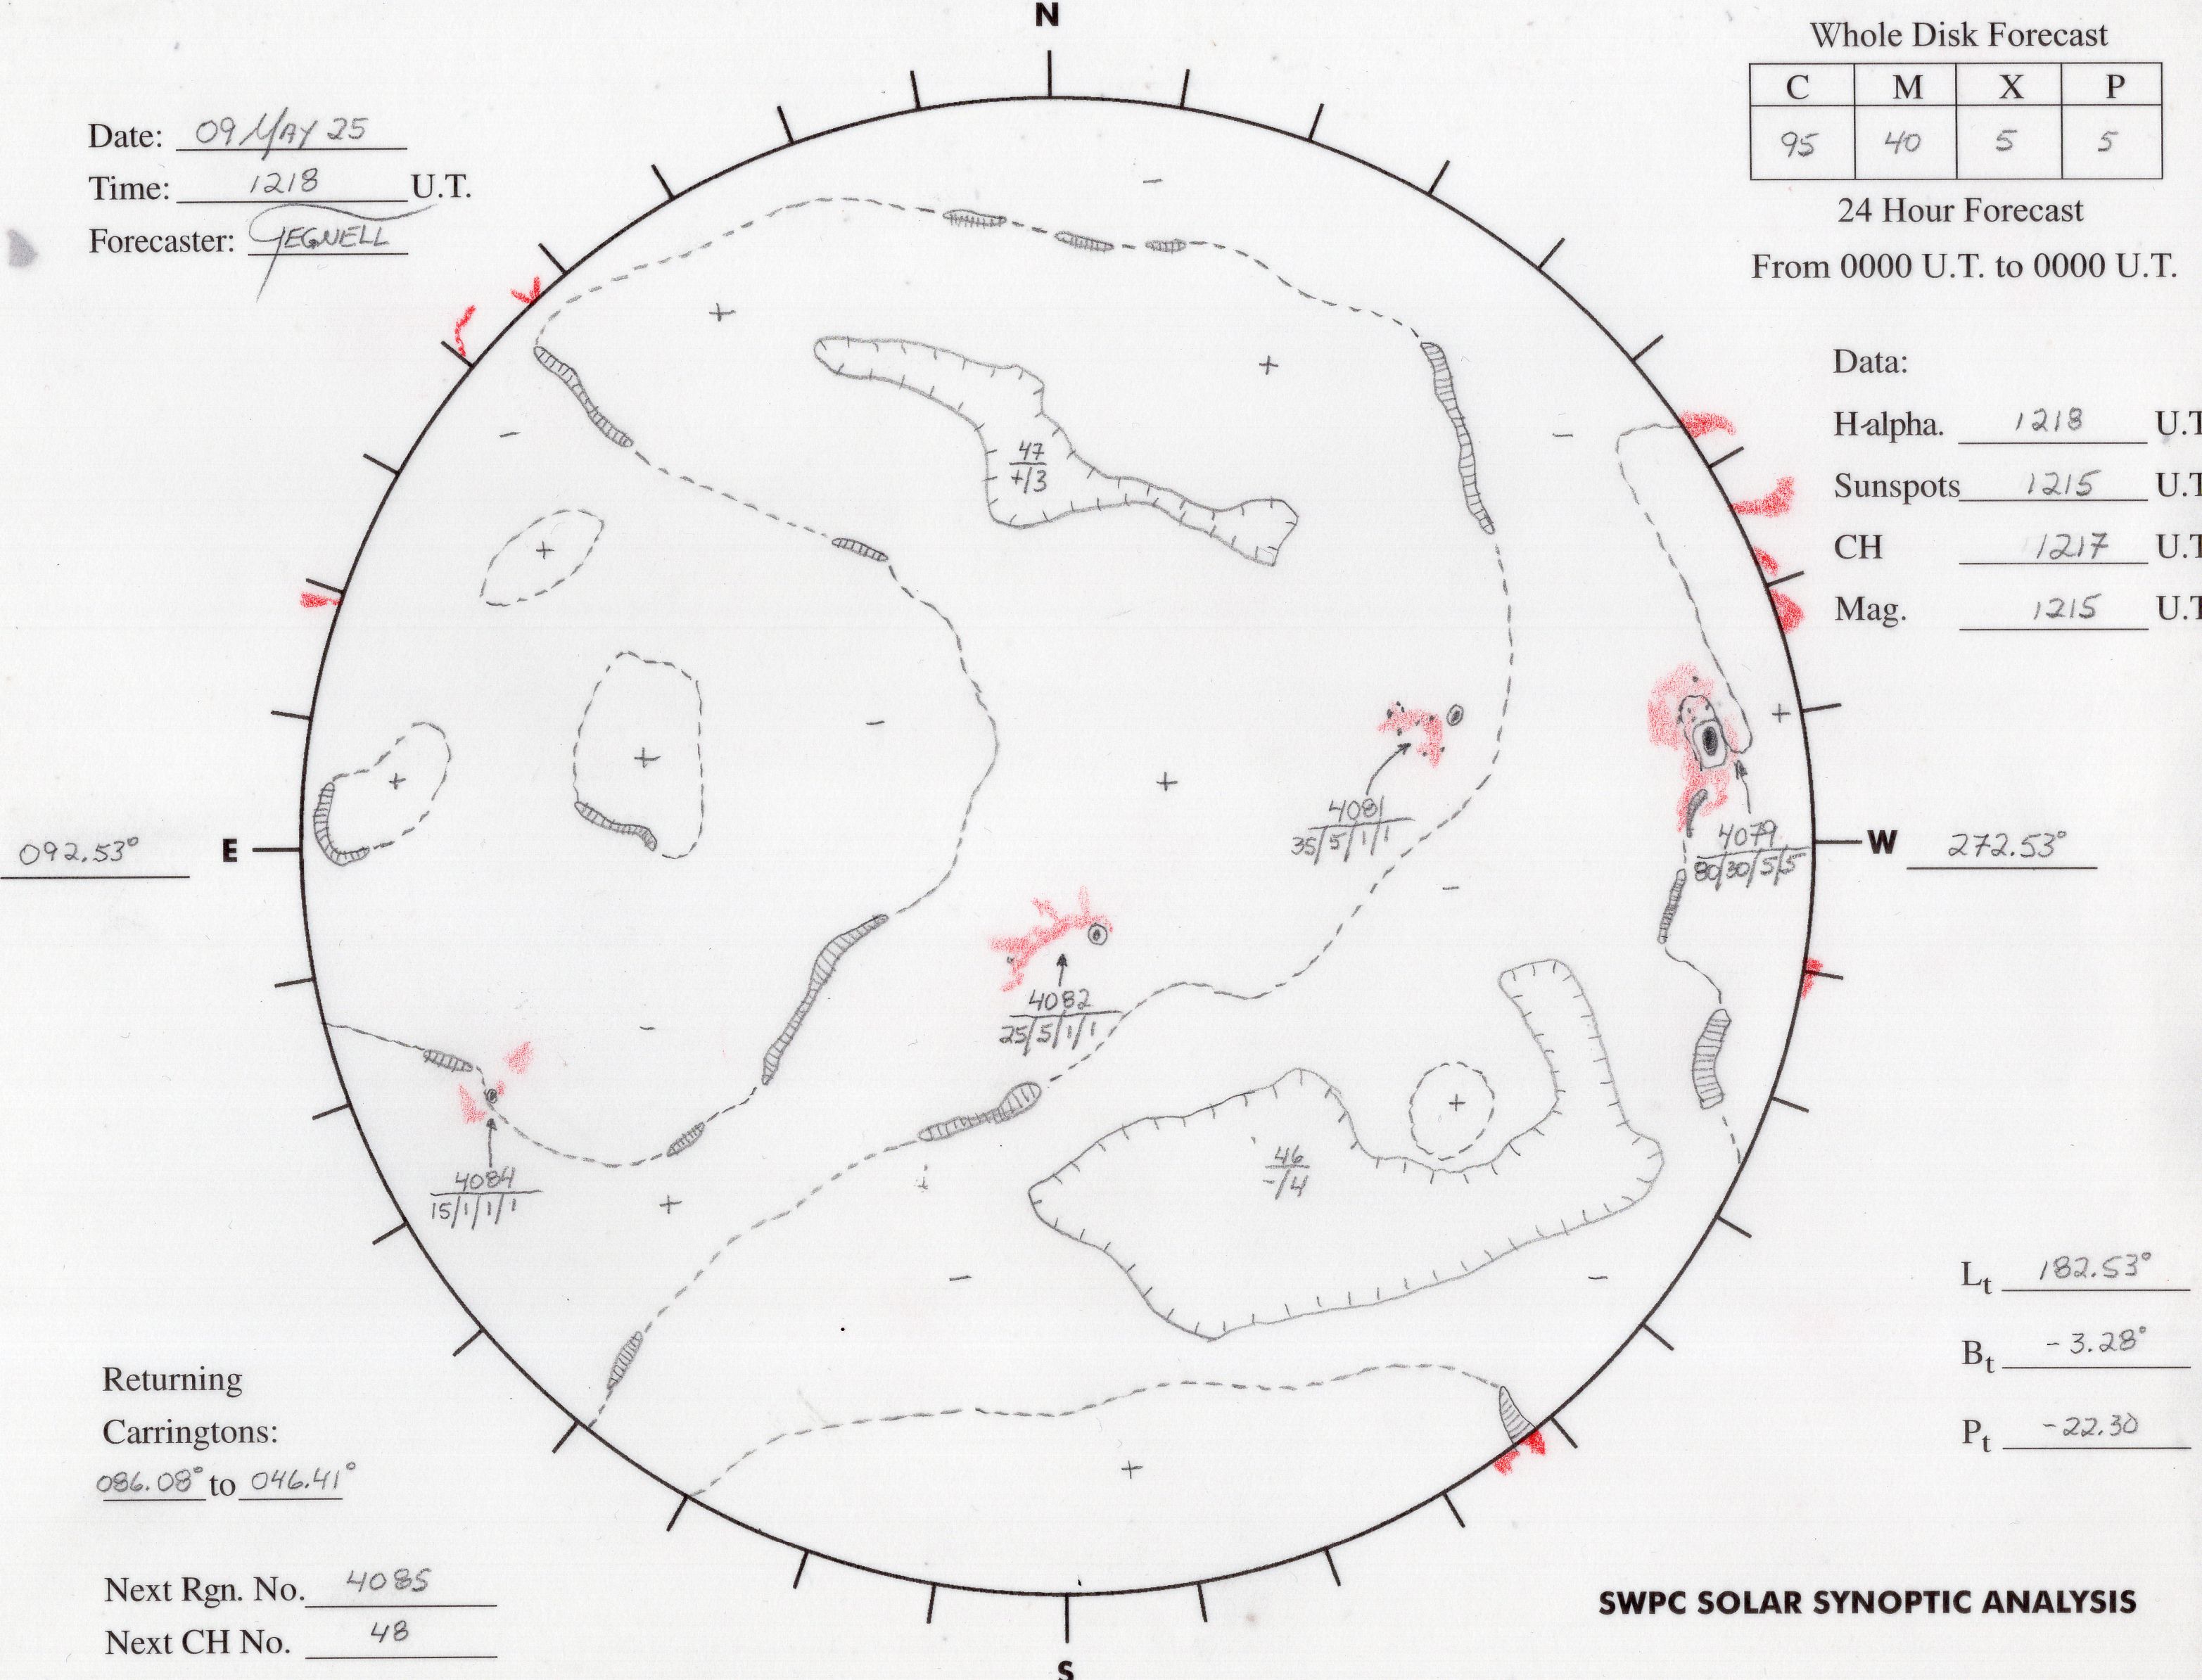
The second half holds: no filament eruption was listed [14], a coronal hole sat across the centre of the disk [16], and its stream was expected “by late on 30 Oct”, with “Unsettled levels” possible [12]. The first half doesn’t. GOES-18 logged nine flares in the 24 hours before the upload, among them a C1.0 [15], seven from a region rotating behind the west limb [14]; and SWPC listed a spotted region on the disk, with “New spots” besides [13][12]. SIDC’s sunspot number was 16, then 3–6, not 0 [18][19]. See section 3.

Misread

Supercomputed from start to now

“This is Lumina, the newest cosmological simulations. They scale over distance and time and have several brand new visualizations out showing where the entirety of astronomical data puts us in terms of being able to supercomput the universe from start to now.” [1 00:01:21–00:01:37]

Lumina follows the universe “from the cosmic dark ages to z = 3” [4]: from 48 million to 2.15 billion years after the Big Bang by its own parameters, about 16% of cosmic history, stopping 11.7 billion years before today (Our analysis) [5 Table 2][8 §10]. Only two companion runs of dark matter alone go on to the present [4]. Its pictures show a simulation started from Planck’s parameters, not a measure of what “the entirety of astronomical data” allows [4][5 Table 2], and newer simulations have followed it [10]. See section 4.

True

Severe flare, huge proton storm

“It was a severe ex-class solar flare that drove a huge proton storm” [1 00:01:57–00:02:02]

On November 11, 2025, Region 4274 produced an X5.1 flare, by our ranking the largest of 2025 [22]. Protons above 10 MeV peaked at 1,460 particle flux units [24], the third-largest event of this cycle by the same ranking [26], and the 77th ground level enhancement began at about 10:20 UTC [2 Abstract], the strongest since 1989 by integral intensity [28 p. 9765]. NOAA rated the flare R3 and the proton storm S3, both “Strong”, one step below “Severe” [23][36]. See section 5.

True

One of four super-aurora storms

“as part of one of the four solar storms this sunspot cycle that created low latitude super aurora.” [1 00:02:02–00:02:07]

“Four” rests on Kp: four storms of this cycle reached Kp 9− or more, November 12, 2025, among them (Our analysis) [29], the same four a 2026 study of ozone loss picked as “four large geomagnetic storms of Solar Cycle 25” [37]. By Dst only two were superstorms, in May and October 2024 [30][31]. On November 11–12, “aurora was visible in the furthest-south U.S. states and below” [32 Abstract]. See section 5.

1 · The episode

A quiet Sun, a cosmic simulation and last November’s storm, in three minutes

The episode of October 28, 2026, ran 3 minutes 9 seconds under the title “They Should Have Warned the Airline” and linked four items: a paper on the radiation measured during the ground level enhancement of November 11, 2025 [2], a preprint on earthquakes and planetary configurations [6], a 2018 Russian paper on temperature during geomagnetic disturbances [7] and the website of the Lumina simulation [4] [1].

In the episode’s words

Quoted from the automatically generated transcript. “ex-class” is its rendering of X-class, “doimeters” of dosimeters, “supercomput” of supercompute and “Luminina” of Lumina; two phrases about the planetary paper, “the scapetta run” and “Proteé”, are unclear and are left as transcribed. The sign-off’s “5:00 a.m.” names no time zone; the video went up at 10:45 UTC [1].

“Good morning, folks. Welcome observers. It is Wednesday, October 28th, 2026, and today we’ve got some epic cosmic eye candy from Lumina. We’ve got solar forcing of weather, planetary alignments and earthquakes, and a solar storm warning for airlines that never went out. We’re starting as always with the last 24 hours on our star and we find the sun slept through class. No solar flares, no sunspots. Plasma filaments are stable. That central coronal hole is likely to amplify solar wind conditions towards the end of the week, but that is also expected to be mild.”

“Up next, folks, some eye candy. This is Lumina, the newest cosmological simulations. They scale over distance and time and have several brand new visualizations out showing where the entirety of astronomical data puts us in terms of being able to supercomput the universe from start to now. Observers know you have links to everything I say and show here in the morning news, every article, every day, and that includes this Luminina project. But a word of caution, you can get a little lost in that website if you have a habit of losing track of time while entertained.”

“Now, we’re going back to November 11th, 2025, almost a full year ago. It was a severe ex-class solar flare that drove a huge proton storm as part of one of the four solar storms this sunspot cycle that created low latitude super aurora. Here they’re saying that while no official radiation warnings went out, there were in fact flights whose doimeters showed the airline should have been warned and redirected on their flight path away from the radiation bombardment at high latitude. Now, as if that’s not bad enough, the reason they didn’t warn was because the models said they didn’t have to. But high energy protons penetrated deep anyway. Who can tell me why?”

2 · The papers

Four links, and what the episode made of them

Three of the links are papers checked on their own pages; the cards below repeat those pages’ verdicts, with the episode’s words about each. The fourth, Lumina, is rated here, and so are the episode’s Sun and its account of the November 2025 storm.

Radiation on airliners and balloons during GLE 77

What it is
A peer-reviewed article in Space Weather, October 2026, by F. Baird and 17 colleagues, open access under CC BY 4.0 [2]: neutron monitors across the United Kingdom, radiosondes launched from the UK and the Netherlands, and radiation monitors on two flights from London Heathrow to New York during the ground level enhancement of November 11, 2025 [2 Abstract]. The episode’s link “Solar Storm Missed Airline Warning” [1].
What the authors report
“During the event no international radiation advisories were issued for aircraft; the measurements show that a moderate advisory should have been issued” [2 p. 1]. Balloons from Lerwick, in Shetland, crossed ICAO’s thresholds at business-jet and supersonic altitudes for “several hours in the airspace above Shetland” [2 p. 14], and at the event’s peak the paper estimates about 58 µSv an hour at 42,000 feet, within the airliners’ range of about 36,000 to 42,000, “very likely” above the moderate threshold of 30 [2 p. 12][2 p. 2]. The two flights’ own monitors stayed below the thresholds: on the Heathrow–New York flight “ICAO moderate was not exceeded” [2 p. 14], and the Heathrow–Newark flight saw no significant increase [2 p. 1].
What the episode said

“a solar storm warning for airlines that never went out” [1 00:00:23–00:00:26]

“Here they’re saying that while no official radiation warnings went out” [1 00:02:10–00:02:12]

“there were in fact flights whose doimeters showed the airline should have been warned and redirected on their flight path away from the radiation bombardment at high latitude.” [1 00:02:14–00:02:23]

“the reason they didn’t warn was because the models said they didn’t have to.” [1 00:02:26–00:02:30]

“But high energy protons penetrated deep anyway.” [1 00:02:30–00:02:33]

In our check of Baird et al. (2026), which read it in full: “No airline warning went out” True; “No official radiation warnings” Partly true; “Planes should have been rerouted” Misread; “Models said no warning needed” True; “High-energy protons went deep” True; “Thresholds topped over Shetland” True (the paper’s own claim). The paper blames the advisory service, which “relies entirely on numerical models” [2 p. 12], and never mentions rerouting. NOAA’s proton warning at 10:28 UTC and its alert at 10:29 did name high-latitude flights [23], but those are public bulletins; the advisories the paper means are the international ones issued to aircraft, and none went out for radiation [2 p. 1].

Earthquakes and planetary configuration dates

What it is
A preprint by Theodoros Nikitopoulos on Research Square, posted October 20, 2026, not peer reviewed, CC BY 4.0 [6]. The episode’s link “Planetary Alignments and Earthquakes” [1].
What the author claims
For days with earthquakes above magnitude 6.5 in 2010–2012 and dates picked from the planets’ positions, “Observed same-day overlaps exceeded surrogate expectations in all three years, and the combined three-year analysis also showed a significant excess (p = 0.0009)”, “motivating further investigation of their geophysical basis without assuming a physical coupling mechanism” [6 Abstract].
What the episode said

“showing statistical proof of seismic upticks during periods where the planets gather on a line.” [1 00:00:53–00:00:58]

“Look was at magnitude 6.5 and larger earthquakes.” [1 00:00:58–00:01:01]

In our check of Nikitopoulos (2026): “Quake upticks when planets align” Misread; “Magnitude 6.5 and larger quakes” True; “Dates come from planet geometry” Misleading (the paper’s); “Overlaps beat chance, 2010–2012” True (the paper’s); “Dates and quakes correspond” Overstated (the paper’s). That check reproduced the paper exactly from public data, and found that its “configuration dates” are sign flips in a singular value decomposition, not alignments. A test it fixed in advance found no excess in other years (p = 0.23 for 2013–2025 and 0.14 for 2000–2009), and the author’s own code gives a much weaker one, in an exploratory run.

Temperature during geomagnetic disturbances

What it is
A peer-reviewed paper by A. A. Karakhanyan and S. I. Molodykh, published in December 2018 in Russian in Solnechno-Zemnaya Fizika and in English in Solar-Terrestrial Physics 4(4), under CC BY-NC-ND [7]. The episode’s link “Solar Forcing Temperature and Climate”, to the Russian edition [1].
What the authors claim
“As a proxy of solar activity we take the PC index of geomagnetic activity, designed to monitor the geomagnetic field at high latitudes.” … “We identify the presence of a high degree of correlation between the temperature in the 925–700 hPa layer and the proposed index of solar activity effect.” [7 Abstract]
What the episode said

“So, let’s head over to the article list today.” [1 00:00:41–00:00:44]

“a paper out of Russia that says solar activity ties extremely well to variations in temperature at ground level.” [1 00:01:04–00:01:09]

“Sometimes this is about the UV load and sometimes it’s about where the pressure and clouds and precipitation are found. Those are also taking their cues from that same solar activity.” [1 00:01:09–00:01:18]

In our check of Karakhanyan and Molodykh (2018): “Sun tracks ground temperature” Overstated; “Clouds and rain take Sun’s cues” Overstated; “A high degree of correlation” Misleading (the paper’s abstract); “Maps show a storm response” Unsupported (the paper’s); “Indices alone: opposite signs” True (the paper’s); “A 2018 paper in today’s list” Context. The index is mostly the local humidity anomaly; the evidence is four storms and 16 hand-picked areas, with no test of significance; and the temperatures are 0.8–3 km up, not at ground level.

Lumina, a simulation of cosmic dawn

What it is
The website of the Lumina project, “A 500 cMpc radiation-hydrodynamics simulation from cosmic dawn to z = 3” [4], and the paper it announces: A. Sadain and 12 colleagues on recombinations in Lumina and the smaller Thesan runs, in The Open Journal of Astrophysics, October 15, 2026, open access under CC BY 4.0 [3]. The episode’s link “Lumina Project” [1].
What the authors report
How much the gas between galaxies clumps, and so how fast its ionized hydrogen recombines, during reionization: the simulations “show an approximately universal clumping evolution at the 10–20% level when parametrized by the global ionized fraction” rather than by redshift [3 Abstract].
What the episode said
“This is Lumina, the newest cosmological simulations. They scale over distance and time and have several brand new visualizations out showing where the entirety of astronomical data puts us in terms of being able to supercomput the universe from start to now.” [1 00:01:21–00:01:37]

Rated on this page: “Supercomputed from start to now”, Misread (section 4). The paper says nothing about the episode’s framing; its subject is reionization’s photon budget, the competition between the sources of ionizing photons and “the sinks that consume them through recombinations” [3 §1].

The promotion: four live events

What it is
Four “State of the Earth” events of the presenter’s Observer Ranch, one a month: November 14 near Sarasota, Florida (billed as Tampa), December 12 in Houston, January 23, 2027, in Scottsdale (billed as Phoenix) and February 20, 2027, in El Segundo (billed as Los Angeles). Three hold sessions on his courses Master the Disaster and Phoenix Rising, and all four a VIP dinner; tickets cost $99.95 to $149.95, VIP seats $349.95 to $399.95, and there is “No live stream” [38]. Not used as evidence, and not rated here.
What the episode said
“Folks, we’re just two weeks away from Florida. The final four State of the Earth events are coming each of the next four months. Master the Disaster Phoenix Rising live Q&A and a social event afterwards. Links to register for the last events are found below.” [1 00:02:36–00:02:52]
What is disclosed
The description lists the four events under “LIVE EVENTS” and repeats the courses, the promo codes (“10% OFF with Promo Code: SOLAR”) and the bunker builder’s referral code of earlier episodes; the video’s data carry no paid-promotion flag [1]. The Los Angeles event, “Pole Shift 2”, features a guest whose “ECDO theory” its page promotes [38]; see our check of ECDO’s claims.

Not rated.

3 · The Sun

Nine small flares, a few tiny spots, and a coronal hole at the centre of the disk

“No solar flares, no sunspots. Plasma filaments are stable. That central coronal hole is likely to amplify solar wind conditions towards the end of the week, but that is also expected to be mild.” [1 00:00:30–00:00:41] The video went up at 10:45 UTC on October 28, so we checked the 24 hours before it [1].

In the forecasters’ words

From the Space Weather Prediction Center’s Forecast Discussion and SIDC’s daily bulletin; times are UTC. “CH HSS” is a coronal-hole high-speed stream.

“Solar activity was at low levels. Region 4561 (S11W91, Dai/beta) rotated out of view while producing B-level enhancements. Region 4562 (S17E34, Axx/alpha) was relatively stable and quiet. New spots were observed near S19W54, but remain unnumbered at this time.”

SWPC, October 28, 0030 UTC, the last before the episode [12]

“The only C-class flare was SIDC flare 8806, a C1 that peaked on 28 Oct at 06:13 UTC. It was emitted by SIDC Sunspot Group (SG) 990 (NOAA Active Region [AR] 4561, Beta magnetic configuration) that is now located behind the solar limb.”

SIDC, October 28, 12:31 UTC, after the episode [18]

“Enhancements from a recurrent, equatorial positive polarity CH HSS are likely by late on 30 Oct.” … “Unsettled levels are possible by late on 30 Oct due to aforementioned CH HSS effects.”

SWPC, October 28, 0030 UTC [12]

Flares, 24 hours before the upload

Our analysis

9

In GOES-18’s list, eight of class B and a C1.0 at 06:13 UTC, four and a half hours before the upload; the flux stayed at C level for 5 minutes. None of class M all week [15].

Regions with sunspots

2

In SWPC’s summary for the end of October 27: Region 4562 on the disk, with one spot at S17E34, and Region 4561 at the west limb with four; besides them, “New spots” near S19W54, not yet numbered [13][12].

Sunspot number, October 27 and 28

16 and 6

SILSO’s estimated international sunspot number, from 22 and 23 stations; SIDC’s midday bulletin had 3 for the 28th. A spotless Sun scores 0 [19][18].

The nine X-ray events of October 27, 10:45, to October 28, 10:45 UTC
Peak, UTCClassRegionNote
Oct 27, 17:46B4.24561With a radio burst at 245 MHz
Oct 27, 21:19B6.24561
Oct 28, 00:23B5.44561
Oct 28, 01:49B5.94561
Oct 28, 03:23B7.94561
Oct 28, 04:45B4.4—No region given
Oct 28, 04:59B6.04561
Oct 28, 06:13C1.04561The only C-class flare; from “behind the solar limb”, in SIDC’s words
Oct 28, 08:39B8.4—No region given

X-ray events from the Center’s edited events for October 27 and 28, as updated at 15:27 and 15:57 UTC on October 28 [14]; GOES-18’s flare list holds the same nine [15]; SIDC’s description from its bulletin [18]. The C-class flare before them was a C1.1 at 02:48 UTC on October 27 [15], from Region 4560 [14], which SIDC said was flaring “from behind the west limb” [18].

Our analysis

Small spots in NASA’s image

In the Solar Dynamics Observatory’s quick-look image of the visible surface at 10:00 UTC on October 28, 45 minutes before the upload, the disk looks spotless at full-disk scale [21]. At full resolution three small dark features stand out from the granulation: two small spots near S19W61, the “New spots” SWPC had reported near S19W54 at the end of October 27, carried west by the Sun’s rotation; a faint one at S17E28, Region 4562’s place; and a dark pore near N14E15 [21][12]. This is our reading of a quick-look image, not a spot count; it agrees with SWPC’s and SIDC’s records [13][18].

Our analysis

The rest of the sentence

“Plasma filaments are stable” fits the record: the edited events list no disappearing filament for either day, and the last eruption, near N30E75, came at 21:42 UTC on October 26, before the window [14][12]; SWPC’s synoptic analysis of 05:37 UTC on October 28 shows filaments across the disk [16]. “That central coronal hole”: a positive coronal hole, CH 07, spans the central meridian on the same map [16], having “reached the central meridian on the evening of October 26”, SIDC said [18]. “Towards the end of the week … mild”: SWPC expected its stream late on Friday, October 30, with unsettled levels possible; its outlook of October 26 had a minor (G1) storm likely on the 31st [12][17].

Our analysis

“No solar flares, no sunspots”: Partly true

Half the sentence holds. The filaments were stable [14], the coronal hole sat at the centre of the disk [16], and its stream was forecast for late in the week, mild, as he said [12]. “No solar flares” does not hold: GOES-18 logged nine flares in the 24 hours before the upload, eight of class B and a C1.0 [15], though seven came from Region 4561, which was rotating behind the west limb [14], and the C1.0 too came from behind the limb [18]. Our review of October 26 rated “No solar flares; a quiet star” Partly true for the same reason: the presenter reports a check of “the last 24 hours” and says the flares were absent outright (our review of October 26). “No sunspots” does not hold either: SWPC’s summary at the end of October 27 listed a one-spot region on the disk, and its forecasters had seen new spots [13][12]; SIDC’s estimated sunspot number was 16 for October 27 and 3–6 for October 28, not 0 [18][19]. The Sun was close to what he described, nearly spotless and flare-quiet on the side facing Earth, but not empty.

4 · Lumina

A simulation of the first 2.15 billion years, not of the universe up to now

“This is Lumina, the newest cosmological simulations. They scale over distance and time and have several brand new visualizations out showing where the entirety of astronomical data puts us in terms of being able to supercomput the universe from start to now.” [1 00:01:21–00:01:37]

What Lumina is

“a large-volume radiation-hydrodynamic simulation that self-consistently follows the coupled evolution of the intergalactic medium, galaxies, and AGN through HI, HeI, and HeII reionization down to redshift z = 3”, in a box 500 comoving megaparsecs on a side with 2 × 6000³ resolution elements [5 Abstract]. It started at redshift 49 with the Planck satellite’s 2018 cosmological parameters [5 Table 2], and ran on the Frontier supercomputer at Oak Ridge, on “1,884 compute nodes equipped with 105,504 CPU cores and 7,536 AMD GPUs” [4]. Its site sums it up: “from the cosmic dark ages to z = 3” [4].

What reaches the present

Only gravity. The project ran “two additional dark matter only simulations with 1500³ and 3000³ particles that share the full-physics run’s large-scale phases. They were evolved to redshift z = 0”, to follow objects over the long run or start zoom-in simulations [4]. They have no gas, stars, black holes or light. The full-physics run itself stopped at its planned end: “Lumina reached its final redshift, z = 3”, the site’s news reported on January 18, 2026 [4].

Where Lumina stops, on the 13.8-billion-year scale

Our analysis
  • Lumina’s full-physics run, z = 49 to 3
  • Cosmic time not simulated with full physics

Billions of years after the Big Bang

Our analysis: ages from the expansion of a flat universe, integrated with Lumina’s own parameters (matter 0.3096, dark energy 0.6903, Hubble constant 67.66 km/s per megaparsec, with radiation) [5 Table 2] by the formula in Hogg’s summary [8 §10]. The same calculation with Planck 2018’s lensing parameters gives 13.80 billion years today, as Planck’s Table 2 does, 13.797 ± 0.023, and with its lensing-plus-BAO column, the one Lumina’s parameters come from, 13.786 against Planck’s 13.787 ± 0.020 [9 Table 2]. Lumina’s own 13.805 is a little higher because it counts its neutrinos as massless, so its matter density, 0.3096, sits below Planck’s 0.3111, which includes a neutrino of mass 0.06 eV [5 Table 2][9 Table 2]. The script is cosmic_time.py, under Code and numbers.

Start, redshift 49

Our analysis

48 million

Years after the Big Bang, in the cosmic dark ages before the first stars: Lumina’s initial conditions [5 Table 2].

End, redshift 3

Our analysis

2.15 billion

Years after the Big Bang, when helium’s second ionization was “nearly complete” in the run [5 Abstract][5 Table 2].

Left out

Our analysis

11.7 billion

Years from the end of the run to today, 84% of cosmic history [5 Table 2][8 §10].

The age of the universe at Lumina’s landmarks
RedshiftAgeShare of today’sIn Lumina
4948 million years0.35%The start [5 Table 2]
23146 million years1.1%The earliest image in its gallery, of the baryons and dark matter [4]
7762 million years5.5%Its image of ionized hydrogen, “Bright regions are ionized bubbles around galaxies” [4]
5.21.12 billion years8.1%Hydrogen fully ionized in the median sub-volume [5 Abstract]
41.54 billion years11.2%Its images of helium’s second ionization [4]
32.15 billion years15.6%The end of the full-physics run [5 Abstract][4]
013.8 billion years100%Today, reached only by the dark-matter-only runs [4]

Ages are our calculation with the simulation’s parameters, as in the chart [5 Table 2][8 §10]; the redshifts of the images are as captioned in the site’s media gallery [4].

Our analysis

Simulation, not data

The pictures are the simulation’s, not observations: the gallery shows slices and projections of simulated dark matter and gas at redshifts 3 to 23 [4]. Lumina starts from Planck’s cosmological parameters and from IllustrisTNG’s model of galaxy formation, and is then compared with data: its optical depth to the cosmic microwave background is “in excellent agreement with Planck”, and the thermal history of its gas between galaxies “broadly consistent with observational constraints” [5 Table 2][5 Abstract]. “The entirety of astronomical data” claims far more than that. The project’s data are “currently not publicly available” [4].

The newest?

New, yes: the reference paper was posted on May 14, 2026, and accepted by Monthly Notices of the Royal Astronomical Society on August 3 [4][5], and the latest paper came out on October 15 [3]. “The newest” is loose. The GION suite of ten full-sky simulations was posted on October 23 [10 Abstract], and a July preprint presents “the first simulation of the entire history of the universe, from deep in the inflationary epoch to the present-day cosmic structure” [11 Abstract], a study of how matter clumps, not Lumina. The Lumina paper lists its simulation among other recent ones of reionization, such as CROC, CoDa, SPHINX, SPICE and Thesan [3 §1].

Lumina’s site is marked “© 2026 Lumina Collaboration. All rights reserved.” Its media are “intended for public distribution” with credit [4]; we link to them rather than show them. The clumping paper is open access under CC BY 4.0 [3]; the reference paper carries arXiv’s standard licence [5].

Our analysis

“Supercomputed from start to now”: Misread

The episode cites a real project but gets wrong what it covers. Lumina’s own description runs “from the cosmic dark ages to z = 3” [4], and its reference paper says it follows reionization “down to redshift z = 3” [5 Abstract]: by the simulation’s own parameters, from 48 million to 2.15 billion years after the Big Bang, about 16% of cosmic history, ending 11.7 billion years before “now” (our calculation) [5 Table 2][8 §10]. Only two gravity-only companion runs go on to the present [4]. And the visualizations show a simulation started from Planck’s parameters, not a measure of what “the entirety of astronomical data” allows [4][5 Table 2]. What holds: Lumina is new; by its team’s account it is “the first cosmological radiation-hydrodynamics simulation to model both hydrogen and helium reionization simultaneously and self-consistently in a large cosmological volume”, the largest by particle count ever run with its code, on Frontier, “the first exascale system in the world” [4]. “The newest” is loose, as newer simulations appeared within weeks [10].

5 · The 2025 storm

An X5.1 flare, a strong proton storm and a ground level enhancement, in one of the cycle’s four largest storms

“Now, we’re going back to November 11th, 2025, almost a full year ago. It was a severe ex-class solar flare that drove a huge proton storm as part of one of the four solar storms this sunspot cycle that created low latitude super aurora.” [1 00:01:55–00:02:07] It was 351 days before the episode.

The flare

X5.1

At 10:04 UTC on November 11, 2025, from Region 4274, the largest of 2025 in SWPC’s records, by our ranking [22]. R3, “Strong”, on NOAA’s scale, which starts “Severe” at X10 [23][36].

The proton storm

1,460 pfu

Protons above 10 MeV at 02:15 UTC on November 12: S3, “Strong” [24][23], the third-largest event of this cycle by our ranking, after January 2026 and October 2024 [26].

The ground level enhancement

GLE 77

Protons energetic enough to raise the counts of neutron monitors on the ground: the fifth of this cycle [27], and the strongest since 1989 by integral intensity [28 p. 9765].

November 11–12, 2025, in UTC

Scroll sideways to see the whole table →

TimeWhat happened
Nov 10, 09:19An X1.2 flare from the same region, with a coronal mass ejection modelled to arrive early on November 12 [25]
Nov 11, 10:04The X5.1 flare peaks, “NOAA Scale: R3 - Strong” [22][23]
About 10:20The 77th ground level enhancement [2 Abstract]
10:28 and 10:29NOAA’s warning and alert of protons above 100 MeV, naming “passengers and crew in high latitude, high altitude flights” [23]
11:45The Heathrow–New York flight of the GLE 77 paper takes off [2 Abstract]
12:32Protons above 10 MeV pass 100 pfu: S2, “Moderate” [23]
17:05NOAA’s watch for a G4 (Severe) geomagnetic storm on November 12 [23]
23:38A second interplanetary shock, “much more significant” than one at 22:21, passes the ACE spacecraft, upstream of Earth [24]
Nov 12, 00:00–06:00Kp 9−, the storm’s peak, G4 [29]
01:45 to 02:15Protons above 10 MeV pass 1,000 pfu, S3, NOAA’s alert following at 01:55, and peak at 1,460 pfu [23][24]
04:00–05:00Dst at its lowest, −217 nT [30]
18:53The last shock of the storm reaches the L1 monitors, by SWPC’s estimate; the X5.1’s ejection had been modelled to arrive “middle to late on 12 Nov” [23][25]

From SWPC’s edited events, alerts, daily summaries and weekly report [22]–[25]; GFZ’s Kp [29]; Kyoto’s provisional Dst [30]; the GLE 77 paper’s abstract [2].

NOAA’s messages that day

From the Space Weather Prediction Center’s archive of alerts and its weekly report; times are UTC.

“WARNING: Proton 100MeV Integral Flux above 1pfu expected” … “Potential Impacts: An enhancement in the energetic portion of the solar radiation spectrum may indicate increased biological risk to astronauts or passengers and crew in high latitude, high altitude flights.”

SWPC, November 11, 10:28 UTC [23]

“ALERT: Proton Event 10MeV Integral Flux exceeded 1000pfu” … “NOAA Scale: S3 - Strong” … “Radiation - Passengers and crew in high latitude, high altitude flights may experience increasing radiation exposures.”

SWPC, November 12, 01:55 UTC [23]

“During 12 Nov, the geomagnetic field was at G1 (Minor) to G4 (Severe) levels while 13 Nov, activity levels decreased to quiet to G3 (Strong) levels.”

SWPC’s weekly report, November 17 [25]

This cycle’s storms that reached Kp 8− or more, and their Dst

Storm, UTCKpApDst, nT
Nov 4, 20218−72−105
Mar 24, 2023873−163
Apr 23–24, 20238+72−213
Mar 24, 20248+68−128
May 10–11, 20249271−406
Jun 28, 20248−60−107
Aug 12, 20248127−188
Oct 10–11, 20249−116−333
Jan 1, 2025881−212
Apr 16, 20258−75−138
Jun 1, 20258−98−119
Nov 12, 20259−137−217
Jan 19–20, 20269−144−236

Our analysis: every storm of this cycle, from December 2019, whose highest three-hour Kp reached 8− or more, NOAA’s G4 (Kp 8, including 9−) or G5 (Kp 9), with consecutive days merged, from GFZ’s Kp record to October 27, 2026 [29][36]. Kp is the storm’s highest three-hour value, Ap its highest daily value, and Dst the lowest hourly value on its days and the day after, from Kyoto’s provisional values [30]. In bold, the four that reached Kp 9− or more. November 12, 2025, with a daily Ap of 137, is the 63rd most disturbed day since 1932 [29].

The aurora

On November 11–12, “aurora was visible in the furthest-south U.S. states and below”, in “this extremely low-latitude aurora during a G4 geomagnetic storm”, photographed from Tucson, Arizona, at 32° N [32 Abstract]. In May 2024 aurora was seen with the naked eye as close to the magnetic equator as 23.2° south, in Namibia [33 p. 34]; in October 2024 red aurora was “photographed at multiple points over a wide region of Japan” [34 Abstract]. We found no paper yet on where January 2026’s aurora was seen. Lower-latitude aurora came in other storms too: at Rikubetsu in Japan, at 34.7° magnetic latitude, in February and April 2023 [35 Abstract].

How big is “super”?

There is no standard “super aurora”. By NOAA’s scale, G4 storms bring aurora to about 45° geomagnetic latitude and G5 storms to about 40° [36]; in GFZ’s Kp, this cycle had one G5 day, May 11, 2024, and twelve more storms at G4 [29]. The usual line for a superstorm is a Dst of −250 nT or below [31]: only May and October 2024 crossed it [30]. A 2026 study of the ozone losses picks the same four storms as Kp 9− does, “four large geomagnetic storms of Solar Cycle 25” [37].

Our analysis

“Severe flare, huge proton storm”: True

The X5.1 was, by our ranking, the largest flare of 2025, with a 3B flare in visible light, an asymmetric-halo coronal mass ejection with a 1,350 km/s Type II radio sweep, and a radio burst of 10,000 solar flux units at 10 cm [22][25]. The protons that followed peaked at S3, the third-largest event of this cycle by our ranking [24][26], and the most energetic made a ground level enhancement, only the 77th on record [2 Abstract][27], which “appeared to be the strongest one, in terms of the integral intensity, over the past 36 years, since GLE #42 on 29-Sep-1989, and the fourth strongest over the neutron-monitor era” [28 p. 9765]. “Severe” and “huge” are the presenter’s words, not NOAA’s: on its scales the flare was R3 and the proton storm S3, both “Strong”, one step below “Severe”; “Severe” was the level of the geomagnetic storm that followed, G4 [23][36]. The substance holds.

Our analysis

“One of four super-aurora storms”: True

“Four” is the count of this cycle’s storms that reached Kp 9− or more, and the same four have its four deepest Dst minima, −406, −333, −236 and −217 nT [29][30]; November 2025 is one of them, and its aurora was seen at low latitudes [32 Abstract]. Two caveats for readers: by the usual superstorm line only the two storms of 2024 qualify [31][30], and November 2025’s −217 nT is within 5 nT of April 2023’s and January 2025’s [30]; April 2023’s storm also brought aurora to lower latitudes than usual [35 Abstract]. “As part of” is fair: by SWPC’s timeline the storm’s G4 peak, early on November 12, came before the X5.1’s ejection arrived, with the ejection of November 10 from the same region, so the flare and the storm belong to one week of eruptions [25][23].

Code and numbers

Run them

All three scripts need only Python 3. Keep the four CSV files in the script’s folder and run python3 -I sun_window.py; NOAA’s files roll over, so these extracts, made on October 28 at about 16:00 UTC, are the record we used: the flare list [15], the edited events [14], the region summaries [13] and CACTus’s list [20]. python3 -I cosmic_time.py needs no files [5 Table 2][8 §10]. python3 -I storm_numbers.py downloads about 6 MB of public files the first time: GFZ’s Kp (CC BY 4.0) [29], Kyoto’s monthly Dst pages [30] and NOAA’s list of proton events [26]. It stops at October 27, 2026, the last day of the Kp record we used, unless given --until and a later date.

6 · Limits

Where this check could be wrong

What would change these verdicts

  1. 01

    A full-physics Lumina run continued to the present, or a statement from the project that its images show observations [4].

  2. 02

    Final Dst values or revised Kp that move another storm of this cycle past November 2025, or a study that sets out which storms brought “super” aurora [30][29].

  3. 03

    Revised SWPC or SIDC records for October 27–28 [12][18].

Sources

Bracketed numbers refer to this list. For the episode [1], times are positions in the video (hours:minutes:seconds), from the first to the last line of its automatically generated transcript that holds the words quoted. For the papers, Abstract names the part we used, § a section, p. a page and Table a table. The times of NOAA’s and SIDC’s products are UTC. The episode went up at 10:45 UTC on October 28, 2026. We read the sources on October 28, 2026, between 15:58 and 18:01 UTC, except SIDC’s bulletin of October 27, read that day. Links checked October 28, 2026.

  1. 1

    SpaceWeatherNews (S0) (October 28, 2026). They Should Have Warned the Airline | S0 News Oct.28.2026. YouTube video, https://www.youtube.com/watch?v=OPyP2JW3y6g, published 10:45 UTC, 3 minutes 9 seconds, with its description as read on October 28, 2026. Quoted from the automatically generated transcript; times are positions in the video.

  2. 2

    Baird, F., Clewer, B., Ryden, K., Morris, P., Lei, F., Davis, C., Dyer, C., Aspinall, M., Marlton, G., Bocquet, F.-X., Edwards, D., Finn, C., Gibbs, M., Machin, S., Marsh, M., Hammond, K., van Dam, K., and Nedeljkovic, I. (2026). Observations of Atmospheric Radiation Increases During GLE 77 From New Airborne and Ground Level Instruments. Space Weather 24(10), e2026SW005279, published online October 20, 2026. Peer reviewed; open access, CC BY 4.0. The episode’s link “Solar Storm Missed Airline Warning”. Its abstract read here from Crossref; its pages, quoted with p. or Table, as read in full for our check of the paper, where it is checked.

  3. 3

    Sadain, A., Smith, A., Zier, O., Park, H., Bulichi, T.-E., Shen, X., Kannan, R., Liu, R., Bian, Y., Springel, V., Vogelsberger, M., Koehler, S. M., and Hernquist, L. (2026). The Lumina Project: Intergalactic Clumping and Recombination Sinks. The Open Journal of Astrophysics 9, published October 15, 2026. Peer reviewed; open access, CC BY 4.0. The paper the episode’s Lumina link announces. We read the full text as published, arXiv:2606.18382v2; § gives a section.

  4. 4

    Lumina Collaboration. Lumina: Reionization Simulation, the project’s website: its home page and news, and its Project, Publications, Media Gallery and Data Access pages. “© 2026 Lumina Collaboration. All rights reserved.” The episode’s link “Lumina Project”. Read October 28, 2026.

  5. 5

    Zier, O., Smith, A., Shen, X., Liu, R., Kannan, R., Koehler, S. M., Springel, V., Pakmor, R., Vogelsberger, M., Bulichi, T.-E., and Hernquist, L. (2026). Introducing the Lumina project: large-volume radiation-hydrodynamic simulations of the epochs of hydrogen and helium reionization. arXiv:2605.15310v2, accepted by Monthly Notices of the Royal Astronomical Society; arXiv’s standard licence. We read the full text; its Table 2 gives the simulation’s cosmological parameters.

  6. 6

    Nikitopoulos, T. (2026). Temporal Overlap Between Global Seismicity and Planetary Configuration Dates. Research Square preprint, posted October 20, 2026; not peer reviewed. CC BY 4.0. The episode’s link “Planetary Alignments and Earthquakes”. Abstract only, here; checked on its own page.

  7. 7

    Karakhanyan, A. A., and Molodykh, S. I. (2018). Spatial distribution of temperature during geomagnetic disturbances. Solar-Terrestrial Physics 4(4), 59–62, published December 21, 2018. The Russian edition, the episode’s link “Solar Forcing Temperature and Climate”, is Solnechno-Zemnaya Fizika 4(4), 76–81, doi:10.12737/szf-44201808. Peer reviewed; under a CC BY-NC-ND licence, so it is quoted only, from the English edition. Abstract only, here; checked on its own page.

  8. 8

    Hogg, D. W. (1999). Distance measures in cosmology. arXiv:astro-ph/9905116, version 4 of 2000. We read the full text; § gives a section: §10 gives the lookback time, its equation 30.

  9. 9

    Planck Collaboration (2020). Planck 2018 results. VI. Cosmological parameters. Astronomy & Astrophysics 641, A6. We read its Table 2 in the arXiv version, arXiv:1807.06209v4.

  10. 10

    Osato, K., Tanaka, S., Ishiyama, T., Miyatake, H., Nishimichi, T., and Shirasaki, M. (2026). Introducing the GION Lightcone Simulation Suite for Multi-Wavelength Large-Scale Structure Cosmology. arXiv:2610.32388, posted October 23, 2026, submitted to Physical Review D; not yet peer reviewed. Abstract only.

  11. 11

    Jamieson, D., Caravano, A., and Komatsu, E. (2026). Ab Initio Cosmological Simulations: From Inflation to Present-Day Structure Formation. arXiv:2607.28800, posted July 30, 2026; a preprint. Abstract only.

  12. 12

    NOAA Space Weather Prediction Center (October 27–28, 2026). Forecast Discussion, the issues of October 27 (0030 and 1230 UTC) and October 28 (0030 UTC, the last before the episode, and 1230 UTC, after it), from the Center’s archive (ftp.swpc.noaa.gov, pub/forecasts/discussion/). Read October 28, 2026.

  13. 13

    NOAA Space Weather Prediction Center and US Air Force (October 27–28, 2026). Report and Forecast of Solar and Geophysical Activity no. 300 (October 27, 2200 UTC), Solar Region Summaries nos. 300 and 301 (October 27 and 28, 0030 UTC) and Solar and Geophysical Activity Summaries nos. 300 and 301, from the archive (pub/forecasts/). The regions with sunspots are in swpc-srs-2026-10-27-28.csv. Read October 28, 2026.

  14. 14

    NOAA Space Weather Prediction Center. Edited Events for October 27 and 28, 2026, from the archive (pub/indices/events/), as updated at 15:27 and 15:57 UTC on October 28; every line is in swpc-events-2026-10-27-28.csv.

  15. 15

    NOAA Space Weather Prediction Center. GOES-18 X-ray flare list, last 7 days (October 21, 21:19, to October 28, 12:52 UTC) and 1-minute X-ray flux, last 3 days, read October 28, 2026, at 16:00 UTC. The files roll over; the flare list used is in goes18-flares-2026-10-21-28.csv.

  16. 16

    NOAA Space Weather Prediction Center. Solar Synoptic Analysis of October 28, 2026, 05:37 UTC, the forecasters’ hand-drawn map of the day’s sunspot regions, filaments and coronal holes, as served on October 28.

  17. 17

    NOAA Space Weather Prediction Center (October 26–27, 2026). Weekly Highlights and Forecasts and 27-day Space Weather Outlook Table, both issued October 26, 0118 UTC, and the Geomagnetic Forecast of October 27, 2205 UTC. Read October 28, 2026.

  18. 18

    Solar Influences Data Analysis Center (SIDC), Royal Observatory of Belgium (October 27–28, 2026). URSIgram 61027 and 61028, its daily bulletins, issued 12:31 UTC on October 27 and 28. Read October 27 and 28, 2026.

  19. 19

    WDC-SILSO, Royal Observatory of Belgium, Brussels. Estimated international sunspot number, daily values for October 2026, provisional, read October 28, 2026, at 16:00 UTC. CC BY-NC 4.0: used here non-commercially, with credit.

  20. 20

    SIDC, Royal Observatory of Belgium. CACTus, the list of coronal mass ejections it detects in SOHO/LASCO C2 and C3 images, October 22–28, 2026, issued October 28, 13:54 UTC, with C2 images to 05:36 UTC; the list is in cactus-cmes-2026-10-22-28.csv. SOHO is a mission of ESA and NASA.

  21. 21

    NASA Solar Dynamics Observatory and the HMI science team. HMI quick-look continuum image of October 28, 2026, 10:00 UTC, 4096 pixels across, from SDO’s browse archive. Read by us as described in section 3; not reproduced.

  22. 22

    NOAA Space Weather Prediction Center. Edited Events for November 11, 2025 (pub/indices/events/), and the yearly archives of edited events for 2024 and 2025 (pub/warehouse/), which we searched for the largest flares. Read October 28, 2026.

  23. 23

    NOAA Space Weather Prediction Center. Alerts, watches and warnings issued in November 2025, from the Center’s monthly archive (pub/alerts/): among them the X-ray summary of November 11, 10:23 UTC, the proton warning and alert of 10:28 and 10:29, the S2 alert of 12:32, the G4 watch of 17:05, and on November 12 the S3 alert of 01:55 and its summary of 23:38. Read October 28, 2026.

  24. 24

    NOAA Space Weather Prediction Center and US Air Force (November 12–13, 2025). Solar and Geophysical Activity Summaries nos. 316 and 317, from the Center’s 2025 archive (pub/warehouse/2025/). Read October 28, 2026.

  25. 25

    NOAA Space Weather Prediction Center (November 17, 2025). Weekly Highlights and Forecasts, PRF 2620, for November 10–16, 2025, from the Center’s 2025 archive of weekly reports (pub/warehouse/2025/). Read October 28, 2026.

  26. 26

    NOAA Space Weather Prediction Center, hosted by NOAA’s National Centers for Environmental Information. Solar Proton Events Affecting the Earth Environment, 1976–Present, whose last event began on July 30, 2026; ranked by us. Read October 28, 2026.

  27. 27

    International GLE Database. List of ground-level enhancements, GLE 5 to GLE 77, with GLE 73 to 77 on October 28, 2021, May 11, June 8 and November 21, 2024, and November 11, 2025. Sodankylä Geophysical Observatory and University of Oulu. Read October 28, 2026.

  28. 28

    Mishev, A. L., Heber, B., Klein, K.-L., Vainio, R., Mavromichalaki, H., Raukunen, O., Larsen, N., Petrov, N., Nikonov, N., Masson, S., Pesce-Rollins, M., Kress, B. T., Bindi, V., Gerontidou, M., Hörlöck, M., Koldobskiy, S., Riihonen, E., Rodriguez, J. V., and Usoskin, I. (2026). Ground level enhancement GLE #77 on 11 November 2025: a data summary. Advances in Space Research 77(9), 9764–9783. Open access, CC BY 4.0. We read the copy in NOAA’s Institutional Repository, as saved for our check of the GLE 77 paper; p. gives the journal’s page.

  29. 29

    Matzka, J., Stolle, C., Yamazaki, Y., Bronkalla, O., and Morschhauser, A. (2021). The geomagnetic Kp index and derived indices of geomagnetic activity. Space Weather 19, e2020SW002641. Data: Matzka, J., Bronkalla, O., Tornow, K., Elger, K., and Stolle, C. (2021). Geomagnetic Kp index, V. 1.0, GFZ Data Services, as of October 27, 2026. Kp from Geomagnetic Observatory Niemegk, GFZ Helmholtz Centre for Geosciences, CC BY 4.0; counted and ranked by us.

  30. 30

    Nose, M., Iyemori, T., Sugiura, M., and Kamei, T., World Data Center for Geomagnetism, Kyoto (2015). Geomagnetic Dst index: provisional hourly values for the 15 months of this cycle, from November 2021 to January 2026, with a day of Kp 7+ or more, and real-time values for October 2026, from the monthly pages. Read October 28, 2026.

  31. 31

    Meng, X., Tsurutani, B. T., and Mannucci, A. J. (2019). The Solar and Interplanetary Causes of Superstorms (Minimum Dst ≤ −250 nT) During the Space Age. Journal of Geophysical Research: Space Physics 124(6), 3926–3948. Title and record only, from Crossref; cited for the threshold in its title.

  32. 32

    Shaw, J. A. (2026). Low-latitude aurora of 11-12 November 2025. In Light in Nature 2026, Proceedings of SPIE, published October 9, 2026. Abstract only, from Crossref.

  33. 33

    Hayakawa, H., Ebihara, Y., Mishev, A., Koldobskiy, S., Kusano, K., Bechet, S., et al. (2025). The Solar and Geomagnetic Storms in 2024 May: A Flash Data Report. The Astrophysical Journal 979(1), 49. CC BY 4.0. As read for our review of the May 2024 aurora, in its accepted version, arXiv:2407.07665; p. gives its page.

  34. 34

    Kataoka, R., Nakano, S., Uchino, S., and Reddy, S. A. (2025). Extended red aurora associated with super substorm igniting the October 10, 2024 magnetic storm as revealed by citizen science. Earth, Planets and Space 77, 64. CC BY 4.0. Abstract only.

  35. 35

    Manu, V., Shiokawa, K., Zhang, Q.-H., Raj, J. K., Balan, N., Shreedevi, P. R., and Zhang, D. (2025). Occurrence of red-green low latitude aurora during large geomagnetic storms: Two case studies. ESS Open Archive preprint, posted August 14, 2025; not peer reviewed. Abstract only.

  36. 36

    NOAA Space Weather Prediction Center (2023). NOAA Space Weather Scales, with the table of the scales dated December 11, 2023, as read for our guide to Earth’s weakening field.

  37. 37

    Jia, J., Orsolini, Y., Szeląg, M. E., Kero, A., Verronen, P. T., Grandin, M., Espy, P. J., Käki, S., Thomas, N., van de Kamp, M., Koldobskiy, S., Zhang, J., and Partamies, N. (2026). Comparative analysis of middle atmospheric ozone response to four large geomagnetic storms of Solar Cycle 25. EGUsphere preprint, under review for Atmospheric Chemistry and Physics. CC BY 4.0. Its four storms are those of May and October 2024, November 2025 and January 2026, as read for our check of the study.

  38. 38

    Observer Ranch (TicketSpice). Event pages of the State of the Earth tour: Tampa (November 14, 2026), Houston (December 12), Phoenix (January 23, 2027) and Los Angeles (February 20, 2027). Read October 28, 2026, for the promotion only; the events are not rated.
Method

How this was checked

On October 28, 2026, we checked every statement, number and quotation on this page against its source: the episode’s automatically generated transcript, quoted verbatim with its timestamps, and its description [1]; its three linked papers, with our checks of them: the GLE 77 paper, as read in full for its check [2], and the planetary preprint [6] and the Russian paper [7] in their abstracts; for Lumina, the linked paper and the project’s reference paper read in full and the project’s website [3]–[5], the formula and parameters for the age of the universe [8][9] and two newer simulations [10][11]; for the Sun of October 27–28, the Space Weather Prediction Center’s discussions, reports, region summaries, edited events, flare list, synoptic analysis and outlooks, SIDC’s bulletins and CACTus’s list of coronal mass ejections, WDC-SILSO’s sunspot number and an SDO image [12]–[21]; for the storm of November 11, 2025, the Center’s edited events, alerts, daily summaries, weekly report and list of proton events, the GLE database and a data summary of the event [22]–[28]; GFZ’s Kp record, Kyoto’s Dst, the superstorm threshold, four studies of the aurora, NOAA’s scales and a study of the cycle’s four large storms [29]–[37]; and the promotion’s event pages [38]. In all, some seventy quoted passages and fragments, and every number on the page. The three papers are checked on their own pages; nothing here re-rates them.

The verdicts and the items tagged “Our analysis” are our own assessment, built on the cited sources: the flares in the 24 hours before the upload and where they came from; our reading of the SDO image; the age of the universe at Lumina’s redshifts, computed with the simulation’s own parameters; the ranking of this cycle’s storms by Kp and Dst, of its proton events by peak flux and of 2025’s flares by size; and what the visualizations show. The chart is drawn from our calculation, not from any figure of the papers.

Re-run with the hosted scripts: the flare, event, region and CME counts and times of section 3, with sun_window.py on NOAA’s and SIDC’s records as extracted on October 28; the ages of section 4, with cosmic_time.py; and the storm table, the Dst minima, the Ap rank and the ranking of proton events in section 5, with storm_numbers.py on GFZ’s, Kyoto’s and NOAA’s public files. The rest was read from the downloaded records: the minutes at C level from NOAA’s 1-minute flux, the sunspot numbers from SILSO’s file and SIDC’s bulletins, the spots from NASA’s image with scripts of ours that are not hosted, the year’s largest flares from SWPC’s yearly archives, and the times of NOAA’s messages from its alert archive. Not read here: the full texts of the planetary preprint and the Russian paper, which are checked on their own pages (the GLE 77 paper’s is quoted as read for its check), and of the papers marked “Abstract only”; the journal’s own PDF of the Lumina paper, which came back empty, so we read the identical arXiv version. We found no dated release of the Lumina images and no paper yet on where the aurora of January 2026 was seen.

After the page was built, a fresh reviewer who hadn’t seen the drafting re-ran the three hosted scripts, which reproduced every number they cover, and checked every quotation, locator and source; we confirmed the one passage the reviewer could not reach, Mishev and colleagues’ ranking of GLE 77, in the paper itself. No verdict on the panel changed. The changes that followed: the 2.15 billion years is marked as our calculation; the description and the Lumina claim follow the presenter’s hedged wording; the ozone study is said to have picked its four storms, not to call them the cycle’s four; only April 2023’s storm, not January 2025’s, is said to have brought lower-latitude aurora, as the preprint cited documents; this list now names which numbers the hosted scripts re-run; times are in UTC, since the presenter’s time zone is not sourced; runs of three or more references are split; and some fifteen smaller fixes of wording, sources and the scripts. On the cards, two sister pages changed a verdict after their own reviews: our check of the GLE 77 paper, now read in full, rates “Models said no warning needed” True instead of Partly true, since the paper itself blames the advisory service’s reliance on models, and our check of the alignments preprint rates the paper’s claim that its dates and quakes correspond Overstated instead of False. The GLE 77 card was rewritten to match that page.

This page was researched and written with Claude, an AI assistant made by Anthropic, and then re-checked against its sources in a separate verification pass.

The verdicts on this page

Misread
Cites a real source but gets wrong what it says.
Partly true
Part of the claim holds up and part doesn’t.
True
The evidence supports the claim.

All ten verdicts, and how we check

Corrections

Corrections and changes

If we get something wrong, we fix it and record the change below with the date. If a correction changes a verdict, the log says what the old verdict was.

Change log

  1. Published on factchecked.science after a full check against the sources. Built from the episode’s transcript and description, its four links and our checks of the three papers, the two Lumina papers and the project’s website, NOAA’s, SIDC’s, SILSO’s and NASA’s records of October 27–28, NOAA’s records of the November 2025 storm, GFZ’s Kp, Kyoto’s Dst and studies of the storm’s aurora, all read on October 28, 2026, except SIDC’s bulletin of October 27, read that day. A fresh review the same day changed no verdict: it led us to mark the 2.15 billion years as our calculation, to follow the presenter’s hedged wording on Lumina, to describe the ozone study’s four storms as its own choice, to drop a source that did not cover January 2025, to give times in UTC, to quote Mishev and colleagues’ ranking of GLE 77 from the paper, with its page, and to make some fifteen smaller fixes; the GLE 77 and alignments cards follow those pages’ own reviews.

Suggest a correction

Spotted an error, or know a better source? Tell us here. Submissions aren’t published.